
The German Way or the CO
2
Delusion and its Consequences
Extended and updated Version, August 2026, Download as PDF-file: English or German. See also: Opinion on a “Draft Law for Further Development of the Greenhouse Gas Reduction Rate“ as Invited Expert at a Hearing of the German Parliament‘s Committee for Environment, Nature Conservation and Nuclear Safety. Download as PDF: English or German.I. Preliminary Notes
This article is an update of a previous essay that was initiated by a talk-show in November 2019, in which—as in hundreds of similar discussions—the topic of renewable energies was discussed by the participants, but the question, how a secure, stable, and affordable energy supply can be guaranteed for the future with an accelerated phase-out of fossil fuels, was consciously or unconsciously omitted. At the same time, this article provides an overview of the changes in energy production in Germany over the past eight to ten years. The article only touches upon the fundamental questions in climate science, such as climate sensitivity, the greenhouse effect, and the carbon cycle. Its primary focus is, what will happen if our current energy consumption is to be sustained by so-called "renewable energies" while achieving the planned CO 2 emission reductions by mid-century, and what consequences this will have for future energy and climate policy. The very term "renewable energies" is already somewhat confusing. Energy, such as incoming solar radiation, geothermal energy, potential or kinetic energy, can be stored and converted into other forms of energy, but it cannot be renewed. In this sense, fossil fuels are also biospherically stored products that, unlike volatile wind and solar energy, can be accessed in required quantities when needed. Therefore, to distinguish from fossil and nuclear energy sources, it is more appropriate to speak of alternative energy generation. It would be revealing and interesting to see what energy security forecasts the leading thinkers of the IPCC and many environmental organizations would make for 2050 and beyond. Unfor- tunately, these climate experts consistently point only to an alleged threat from fossil fuel emissions, but they ignore the question of a secure energy supply, which is an absolute pre- requisite for a functioning and evolving modern society. If we further follow the claims of these climate prophets, some industrialized nations, like Germany, will have already abandoned their energy policies by then and destroyed themselves. The climate threats caused by CO 2 are shared at the highest political levels of the European Union. On November 27, 2019, after the new EU Commission with its 26 Commissioners was finally approved by the European Parliament, we learned from the announcement of the new EU President, Ursula von der Leyen, that climate protection, environmental protection, and energy policy would be the Commission's future priorities. One trillion € are to be made avail- able for climate protection in Europe over the next ten years (and likely three trillion € over the next 30 years), with the aim of making Europe a global role model. Parts of the European Investment Bank are to be transformed into a Climate Protection Bank. The goal is for Europe to be the first climate-neutral continent by 2050, a goal that will be enshrined in law through the first European Climate Protection Law. And one day later, the EU Parliament actually decided, with 65 % of the votes, to declare a European Climate Emergency. The next step would probably be an Emergency Legislation! The only question is, what will cause an emergency: human-caused climate change or a failed energy policy? Do some politicians actually know what climate is and what it depends on? We could expect a bit more expertise or more comprehensive consultation by neutral experts when decisions are made with such far-reaching consequences. Does one of those, declaring a climate emergency, really know what primarily determines our climate and how climate neutrality could ever be achieved in Europe? This article explains how climate neutrality, a goal the German government committed years ago, will look like for Germany and what consequences it will have. The situation would not be much different for Europe. A copy of the key considerations, along with a cover letter, was sent to the EU President in early 2020, requesting that energy experts review the points raised. However, no response has yet been received.II. Gradual Phase-Out of Fossil Fuels
In 2018 the Intergovernmental Panel on Climate Change (IPCC) [1] published a “Special Report on possible impacts of global warming of 1.5 °C above pre-industrial levels and related global greenhouse gas emission pathways“ [2]. This report is a sequel of previous Assessment Reports, which besides many alarmistic exaggerations also presents Representative Concentration Pathways (RCPs) for reducing anthropogenic CO 2 emissions to restrict global warming to 1.5 °C over the 21st century. A temperature increase less than 2 °C, better only 1.5 °C, was re- commended and decided on the 21st Conference of Parties (COP 21) of the United Nations Framework Convention on Climate Change (UNFCCC). This decision is known as the Paris Agreement [3] and considered as the succeeding consent of the Kyoto Protocol [4]. The RCPs, which are accepted by almost all member states of the UNFCCC (no longer by the USA), are simulations of simple climate models based on unrealistic and speculative assumptions for the CO 2 climate sensitivity (temperature increase at doubled CO 2 concentra- tion; see Harde 2014 [5], Harde 2017a [6]) and also for the carbon cycle (Harde 2017b [7], Harde 2019 [8], Harde 2025 [9]). These RCPs prognosticate significantly too high temperature increases with rising CO 2 concen- tration, and they exclusively trace the ascending CO 2 concentration back to human emissions, while any natural contributions to the temperature and concentration growth are completely neglected. After all, the highly unrealistic scenario RCP 8.5 and its successor SSP5-8.5 — assuming a temperature rise of 4–6°C alongside a tripling of coal consumption, exploding population figures, and no technological or policy progress ("business as usual") — have recently been classified as completely implausible by IPCC scientists themselves (v. Vuuren et al., 2026 [10]). Independent of the question how strong human emissions of CO 2 and other greenhouse gases can really impact our climate and destroy our planet – as perennially announced by some experts (we will discuss this in Subsection: Own Climate Studies a) to e) ) –, we have to look critically to the energy politics of some industrialized states which ratified the Paris Agree- ment and already started to shut-down conventional power plants without caring about a re- liable and affordable replacement of this energy, and without caring about the consequences. As an example for such a misdirected politics we consider Germany; with some smaller modifications this situation also applies to countries like France, Great Britain, Australia or even the United States, when they would decide for the same politics.Kyoto-Protocol: Only for clarification a short remembrance of the agreement of the UNFCCC-
member states in 1997, which is known as the Kyoto-Protocol [4]. Although it followed a long
ratification process till this agreement became effective in 2005, many politicians word wide
announced to abstain from fossil energy sources or to reduce their use in order to restrict
global warming by anthropogenic greenhouse gases, which by some climate experts alone are
made responsible for an observed climate change.
According to the Kyoto agreement all member states of the UNFCCC committed • to reduce the emissions of carbon dioxide up to 2012 by at least 5 % compared to the level of 1990, • and for the period 2012 – 2020 the European Union obliged to reduce the emissions by 20 % till 2020. The German Government even declared as self-commitment • to cut emissions till 2012 down by 20 % and till 2020 by 40 %. • With the Federal Climate Change Act [11] (last amended in 2024), it commits itself to binding climate targets involving a gradual cross-sectoral reduction of greenhouse gas emissions, with the aim of making Germany fully climate-neutral by 2045. If emissions from one of the industrialized nations or the EU exceed the planned reductions, that country can purchase CO 2 certificates from another participating country that is able to exceed the reduction quota. In this way, climate protection is to be implemented on a market- oriented and particularly economically viable basis.III. Energy Consumption in Germany
1. Primary Energy Consumption
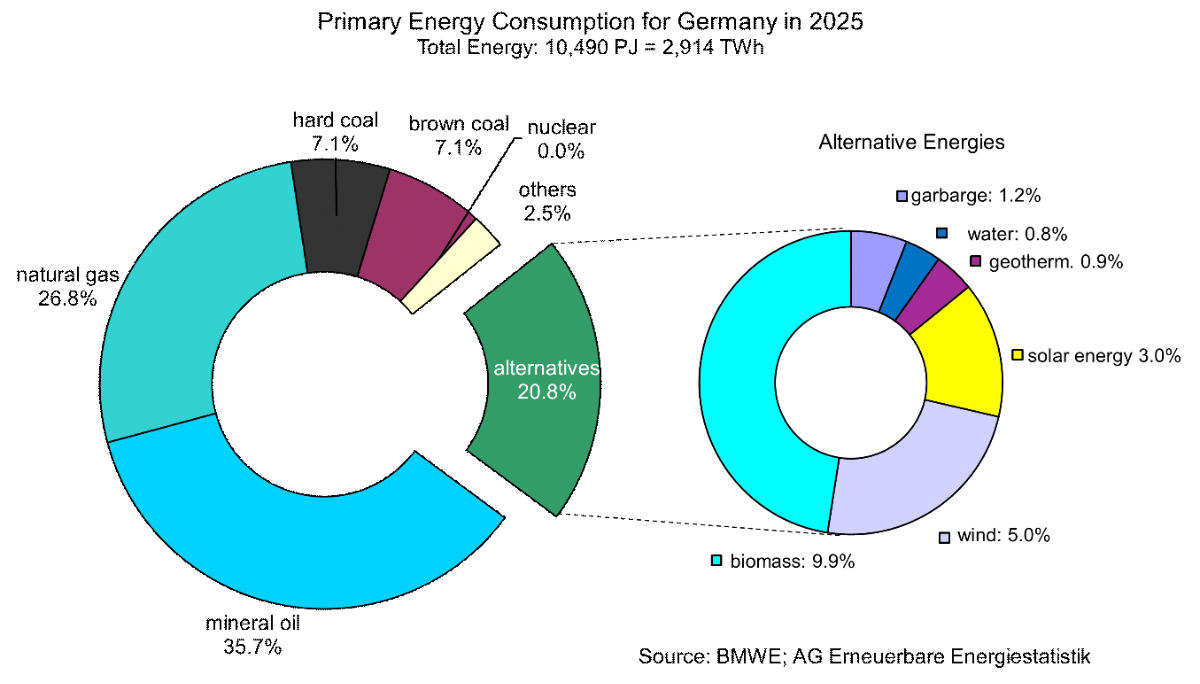
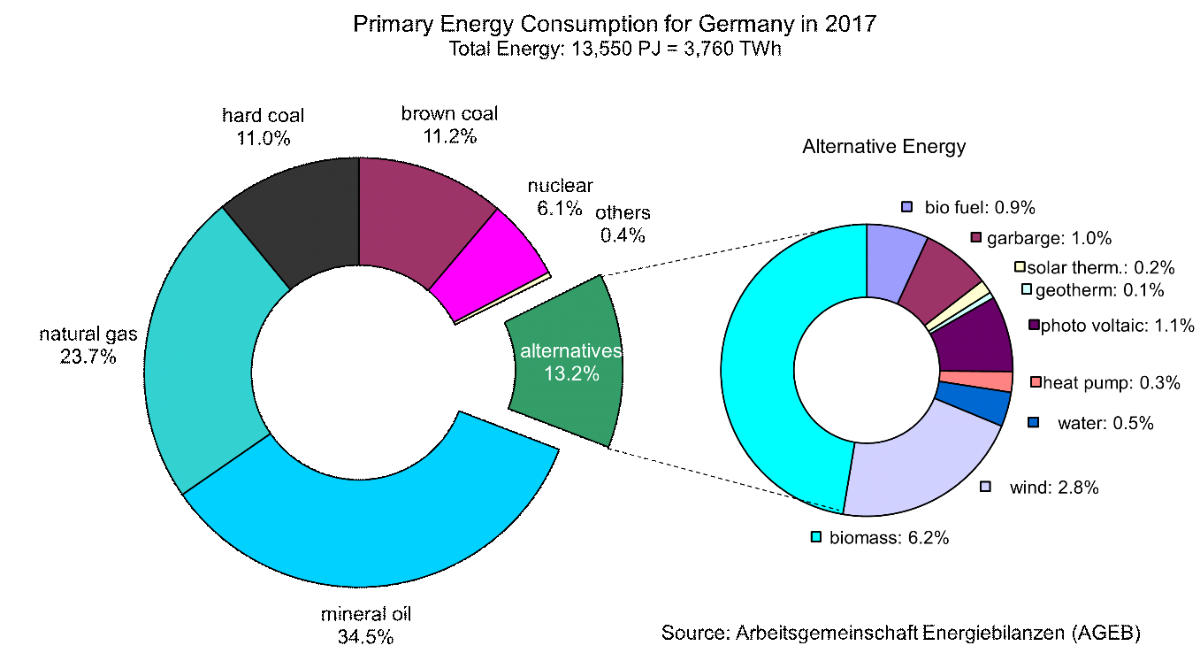
Let us look at Germany's energy balance and its efforts to become 'climate neutral' by 2045. Over the past few years, Germany's Primary Energy Consumption (PEC) has indeed decreased gradually (Fig. 1). In 2017, this was 13,550 PJ (Peta Joules), while the preliminary figure for 2025 is 10,553 PJ (Ministry for Economic Affairs and Energy, 2026 [12]). In Tera-Watt-hours, this is: 10,553 PJ / 3600 s = 2.93 PWh = 2.93 trillion kWh or 2,930 TWh. The steeper decline since 2017 is partly due to reduced heating demand, also due to restrictions during the Corona crisis, but since 2022 it has also been determined by the consequences of the Ukraine war and the as- sociated noticeably higher energy prices as well as growth losses of the German economy. Due to transmission processes and a limited efficiency in converting energy from one form to another, the typical losses of PEC to Final Energy Consumption (FEC) are 35 %. A comparison of the 2017 figures with those for 2025 reveals not only a significant reduction in overall consumption, but also substantial changes within individual sectors (see Figures 2a and 2b). This is evident in the gradual phase-out of nuclear power, with the approved extended operation until April 2023, the commencement of the phase-out of coal-fired power genera- tion, and the continued expansion of alternative energy sources. However, up to now the most important energy sources remain mineral oil with a share of 35.7 % and natural gas with 26.8 %, followed in third place by Alternative Energies (AEs) with 20.8 %. The stronger relative increase for the latter is not only due to the increased expansion from 496 TWh to 606 TWh, but also, almost half of it, to the significant decrease in primary energy consumption. Among the alternatives, biomass currently contributes the largest share with 9.9 %, but further expansion is clearly limited, in order not to further reduce agricultural land. Also hydropower is strongly limited. This raises the fundamental question, how far wind power and photovol- taics – which together account for 8 % in 2025 – will be able to replace fossil fuels and nuclear energy as reliable sources.2. Gross Electricity Generation
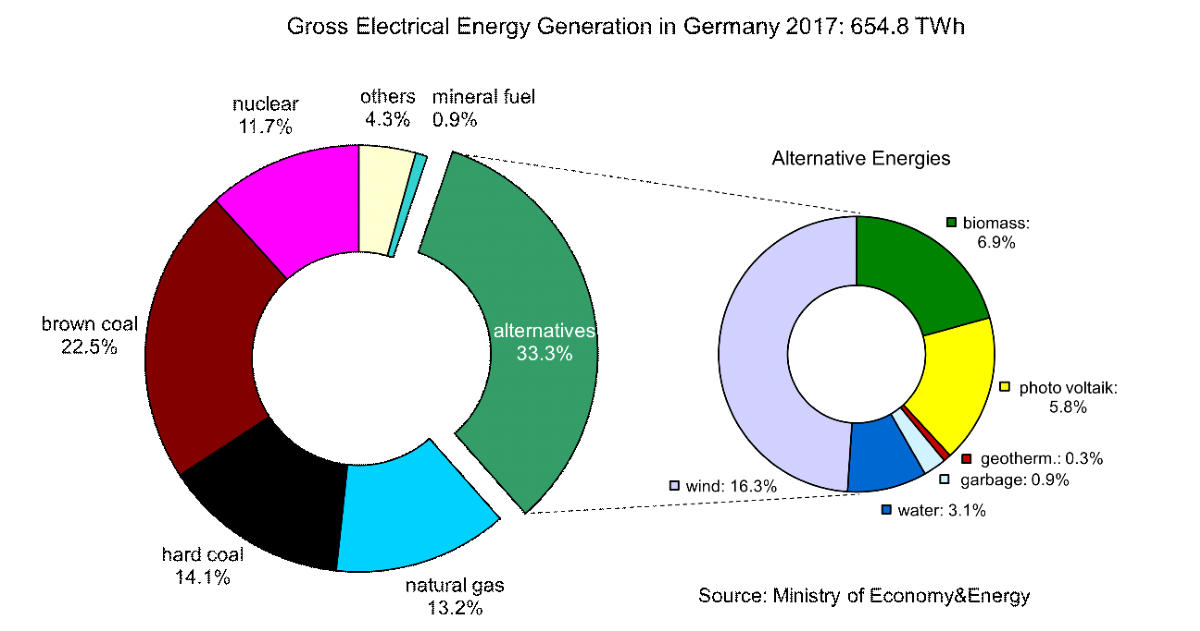
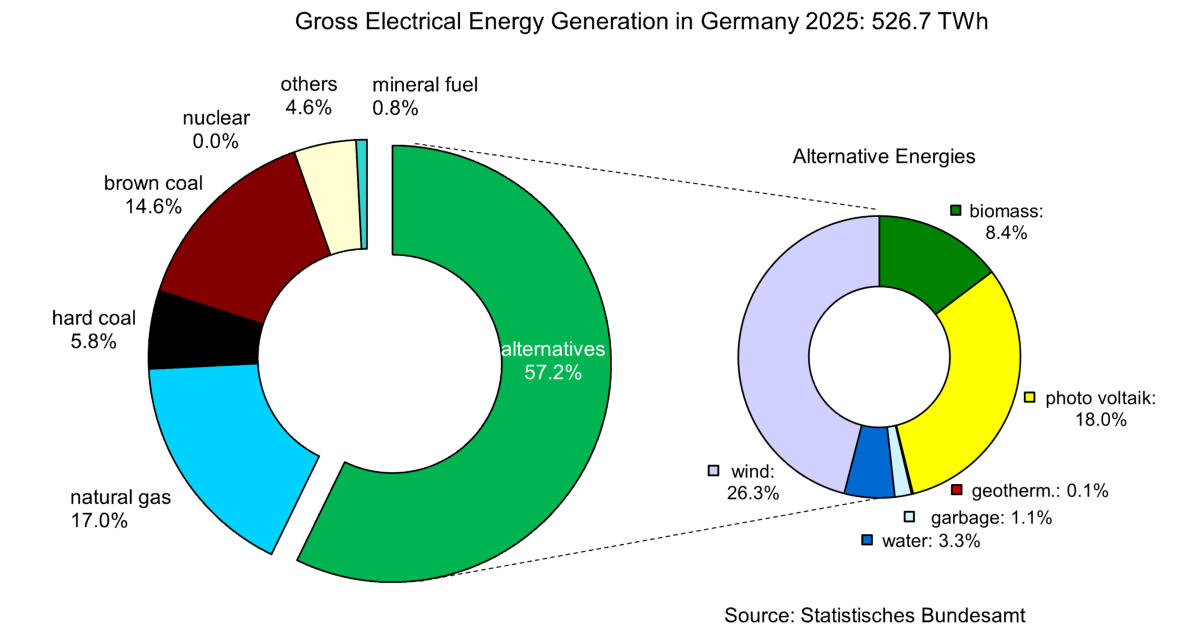
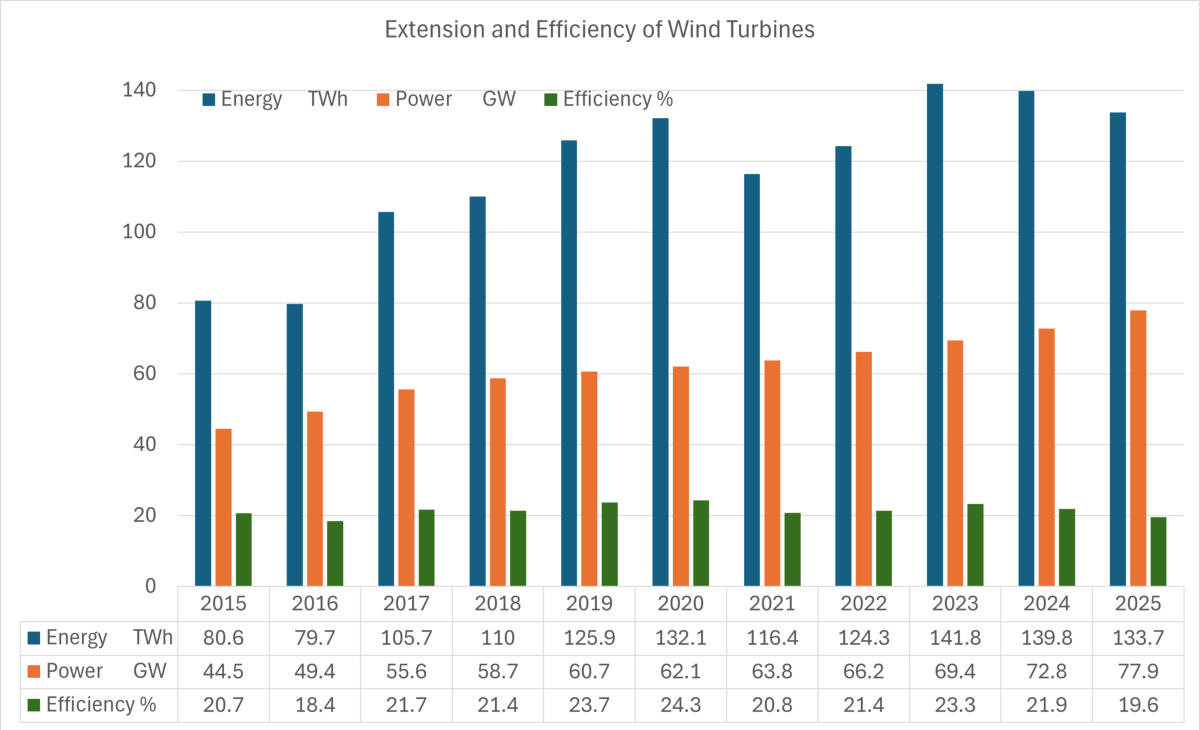
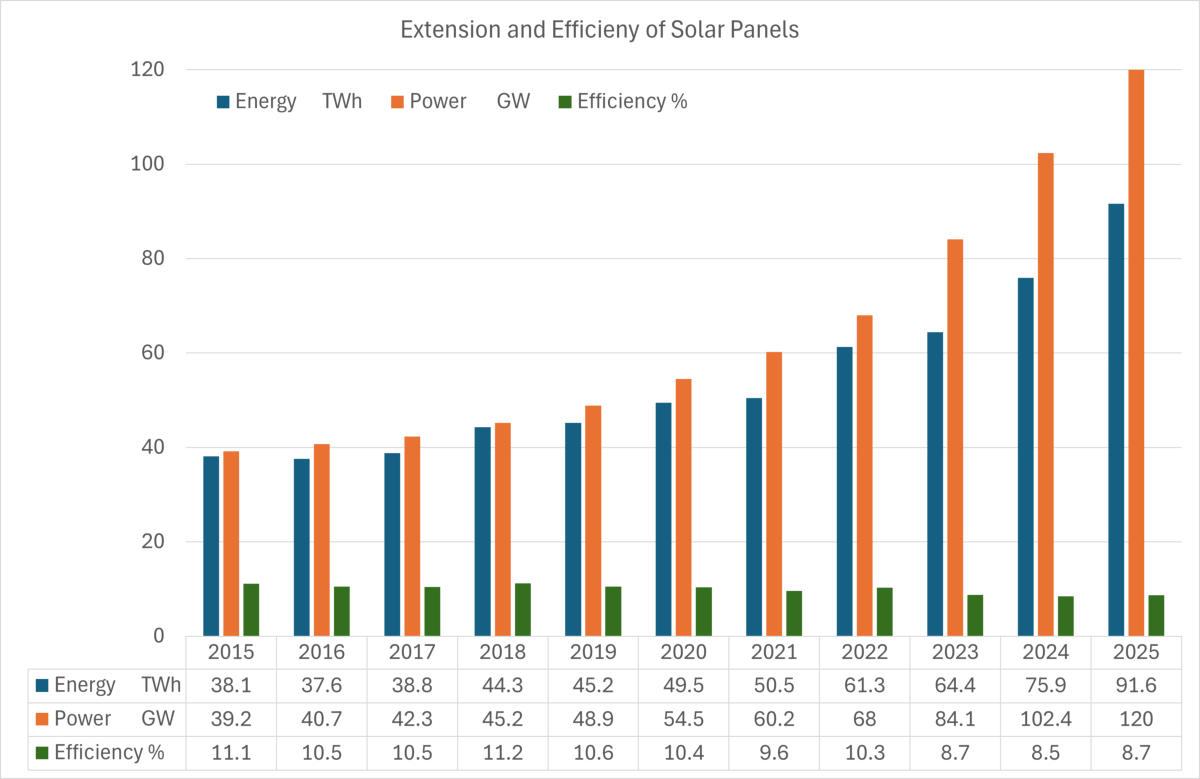
Gross electricity consumption encompasses the total amount of electricity generated and consumed, including losses in power plants and grids, as well as the self-supply of industry. Since 2017, the share of alternative energies in this calculation has improved, increasing from 217.7 TWh of totally generated 654.8 TWh – corresponding to 33.3 % (Fig. 3a) – to 292.2 TWh of totally produced 510.8 TWh in 2025 – corresponding to 57.2 % (Fig. 3b). This represents an increase of 74.5 TWh over eight years, averaging 9.3 TWh per year. Wind power generation accounts for the dominant share with 133.7 TWh, representing 26.3 % of the total electricity production. By the end of 2025, 32,042 wind turbines with a total installed capacity of 77.9 GW were in operation (BMWE [12]; Strom-Report [13]; German Wind Energy Association [14]). The average yield per turbine is calculated to be 4.17 GWh per year (133.7 TWh / 32,042 wind turbines), with an average installed capacity of 2.43 MW per turbine (77.9 GW / 32,042 wind turbines). This corresponds to an average efficiency per plant – and thus a total installed efficiency – of 19.6 % (4.17 GWh / (2.43 MW x 24 x 365 h) = 133.7 TWh / (77.9 GW x 24 x 365 h)) and an effective power output per plant of 480 kW (19.6% x 2.43 MW). Efficiency is largely determined by weather conditions. Over the past five years, a rather inverse trend has emerged between energy yield (Fig. 4a, Blue) and installed capacity (Orange). The number of onshore and off-shore wind farms on average further increased and smaller plants were replaced by larger ones featuring more powerful generators in the 3 - 5 MW class, also with taller towers. As a result, the additional installed capacity has increased by 15.8 GW since 2020. However, the average annual yield has decreased by 1 TWh over this period. While in 2020 efficiency was still above 24% (Fig. 4a, Green), it has now fallen below 20%. The installation of solar power plants has increased significantly in recent years, rising from 39.2 GW in 2015 to 120 GW – a threefold increase (see Fig. 4b, Orange). In 2025, solar energy (Blue) contributed 91.6 TWh – equivalent to 18 % – to gross electricity generation. This is now the second largest contributor, ahead of natural gas with 17 %. The installed capacity of 120 GW is even significantly higher than that of wind power plants with almost 80 GW. Conse- quently, the solar efficiency is only 8.7 % (91.6 TWh / (120 GW x 24 x 365 h). As with wind, there has been an almost continuous decline in efficiency over the last 10 years (Fig. 4b, Green), which is due to weather-related influences as well as the aging of the solar cells, but also to limitations on grid feed-in during periods of temporary overproduction. Due to the strong daily and seasonal fluctuations in both wind and solar power generation, which by no means coincide with daily and seasonal energy consumption, even today the alternative energy generated at peak times cannot be fully utilized. During periods of overproduction, excess energy is ‘sold‘ abroad at additional costs. Conversely, during periods of low wind and solar power generation, electricity must be imported from neighboring countries, mostly generated by nuclear or fossil fuel power plants, and this import incurs further costs. For example, in 2022, so-called dispatch (balancing) measures resulted in additional costs of 2.7 billion € for electricity customers (Breaking Lab [15]), and on a single day, September 27, 2024, costs reached 140 million € (Outdoor Chiemgau [16]). Realistically, it must be assumed that with further reductions in fossil fuel use, the average demand for electricity will increase considerably, necessitating a further accelerated expan- sion of alternative energy sources, especially wind power. At the same time, adequate energy storage for periods of reduced production and buffering against overproduction will be essential. The crucial question, therefore, remains how such a concept can be implemented technically, economically, and within the given timeframe, especially since the expansion of wind power, both onshore and offshore, has not resulted in any discernible increase in recent years – quite the opposite, in fact (Fig. 4a).IV. Supply only by Alternative Energies?
It will be clear to everyone that emissions trading will result in additional costs for energy suppliers and industry due to increased CO 2 emissions (provided they haven't already been relocated), costs which will ultimately be borne by the consumer. Taxpayers have already incurred considerable costs due to the German Government's 2011 decision to take eight nuclear power plants offline in short term and the remaining ones by 2022, in response to the earthquake and subsequent Tsunami that destroyed the Fukushima nuclear power plant in Japan in March 2011. The missing energy has since had to be replaced by new coal and gas-fired power plants, meaning that the planned emission reductions are no longer achievable—on the contrary, emissions have risen again. With its phase-out of nuclear power, Germany is indeed clearly different from France, the United States, Finland, and even Sweden, which has for some time been reversing its nuclear phase-out and investing in the modernization of its nuclear power plants. In 2017, nuclear energy still contributed 6.1 % to the PEC of 3,760 TWh (Fig. 2a), and domestic coal supplied 22.2 %. However, under current political climate discussions and under pressure from climate demonstrations such as "Fridays for Future," the German Government decided in May 2019 to phase out coal by 2038. This share has since decreased to 14.2 % (Fig. 2b). Germany is thus focusing entirely on alternative energies through wind power and solar installations, and for a transitional period also on natural gas. However, with the stated goal of net-zero CO 2 emissions by 2045, not only nuclear power and coal, but also the largest energy sectors — oil (35.7 %) and natural gas (26.8 %) — must be replaced (Fig. 2b). How is this to be achieved? Alternative energy is very expensive (see section VI), and so far, at least, no storage facilities exist for it, nor are they sufficiently available. The same applies to the grid that would need to be specially adapted for this purpose.1. Some Rough Estimate for Supply by Wind Power Plants
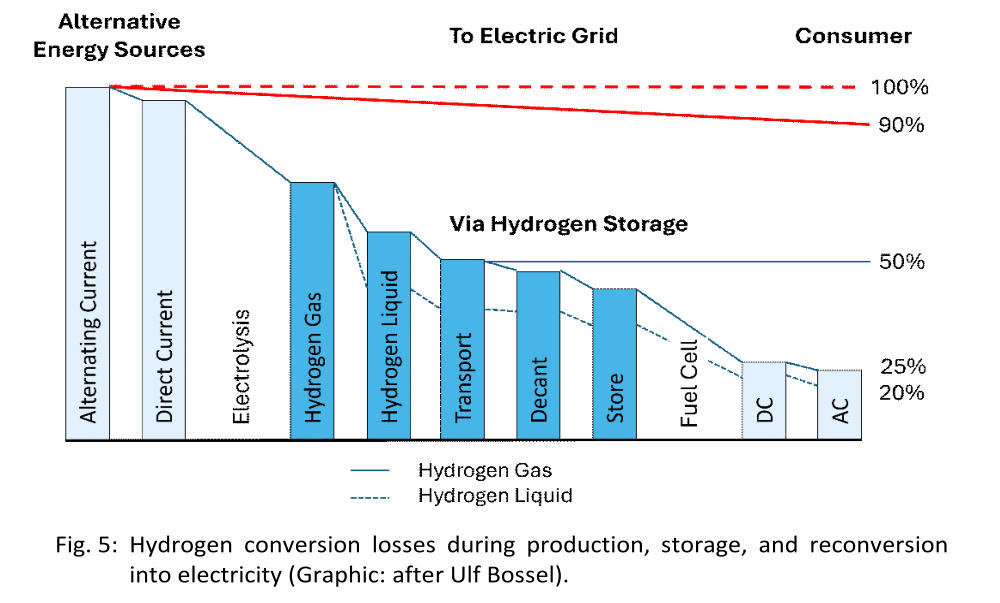
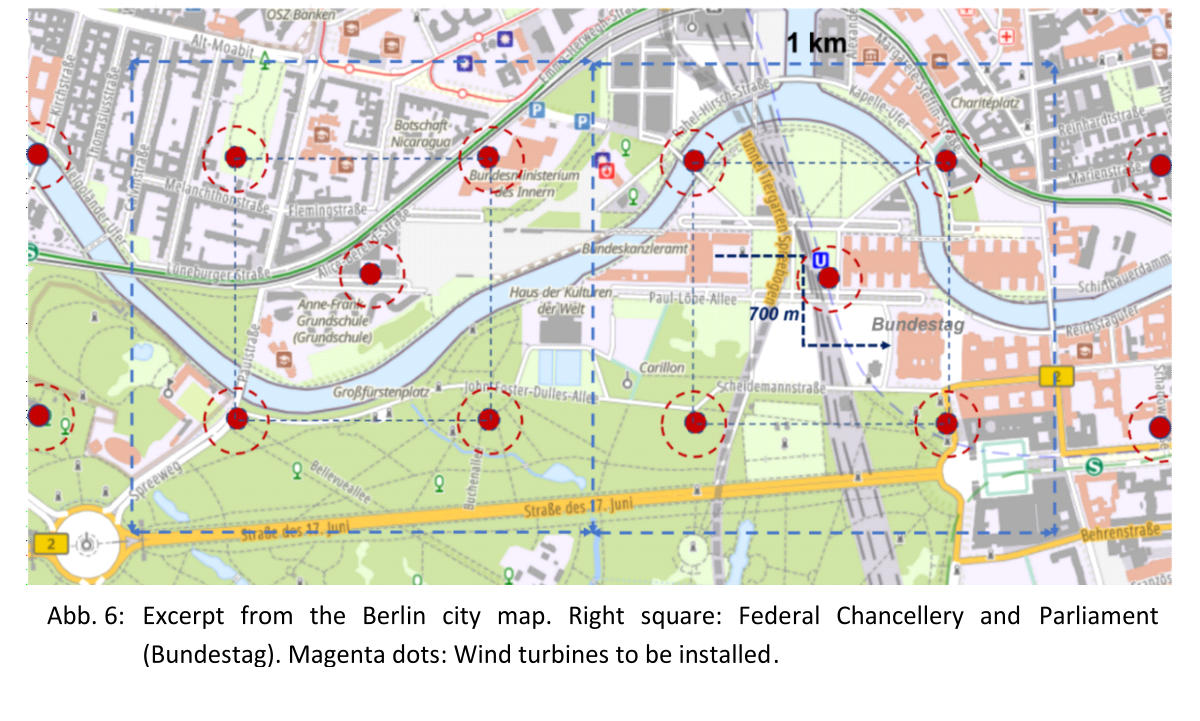
Biomass and water resources are already largely depleted, and photovoltaics also shows stronger restrictions (see below), especially during the winter months. That leaves wind power as the primary option! As mentioned above, at the end of 2025 Germany had 32,042 wind turbines generating 133.7 TWh of electricity (4.6 % of primary energy consumption). To cover the 4.6 % in addition to all mineral oil (35.7 %), natural gas (26.8 %), and coal (14.2 %), totaling 81.3% or 2,369 TWh of the 2,914 TWh primary energy consumption (see Fig. 2b), altogether 568,106 wind turbines would be required. Each turbine would deliver 4.17 GWh over a year, or generate an average output of 480 kW. This rough calculation assumes a wind turbine with an average installed output of 2.43 MW and an availability of 19.6 % see above). However, this would only be feasible with consumption occurring synchronously with the electricity generation. Since the power generated by wind turbines is directly dictated by highly variable weather conditions and is not synchronized with daily energy consumption, the electrical grid and other energy requirements can only be met with sophisticated alternative storage technolo- gies, such as hydrogen or methanol storage, to compensate for the significant differences between generation and consumption over time and longer periods. Currently, such storage technologies are not yet available, only their concepts, but if they become available soon, the conversion process (both ways) or the use of hydrogen as synthetic fuels will result in a further significant loss of available energy, which can only be compensated for by installing additional wind turbines. Thus, the electrolysis process for producing hydrogen gas has an efficiency of 65 % (Fig. 5). Compressing or liquefying the gas easily results in a further loss of 10 %, as does transport in a gas distribution network to end users or conversion into other, more easily storable deriva- tives such as methanol or ammonia. To reuse temporarily stored H 2 gas or its derivatives for electricity generation, the overall conversion process, both ways, achieves an efficiency of only 20 – 25 %. If we can assume an average, estimated efficiency of 35 % for further use in various forms of energy, such as synthetic fuel, heating gas or electricity, the overall efficiency for energy supply by wind turbines is not more than 7 % of the specified nominal power of a plant. To store all the energy generated by wind turbines, this means to secure the required primary energy consumption with a conversion rate of 35 %, requires 1.62 million wind turbines (568,106 / 35 %) with the assumed rated output. If at least 90 % of the electrical energy needs to be stored, while 10 % could be fed directly into the grid, 1.52 million wind turbines are still required, giving a slightly rising overall efficiency of 8.1 %. Assuming that suitable storage is available by 2045 and that final energy consumption does not increase significantly over the next few years, or can at least be stabilized at today's level through a higher conversion efficiency in production and storage technology, Germany will need approximate- ly 1.5 million wind turbines with an average rated output of 2.3 MW in 2045 to ensure a sufficient, independent energy supply, according to the above considerations. These figures will increase ac- cordingly in case of a higher demand and reduced efficiency. This means that over the next 20 years, at least 76,000 new wind turbines per year, or 210 per day, would have to be built and connected to the grid. Given a wind turbine's lifespan of 20 years, this also means that due to the replacement of older units even after that period the production must be continued at least at the same level. Looking back at the last seven years, during which the total number has only increased by 1,500, we have to ask how such an expansion and net-zero emissions by 2045 are to be achieved. But we'll manage it! “After all, Germany is known for its short planning approval and permissions for construction projects or the re-zoning of land. Expropriation of land for the public good can also be implemented quickly. And with Chinese loans and the help of Chinese companies for the construction and connection of the wind turbines, it will surely work out!“ Germany covers a total area of 360,000 km 2 meaning that on average, four to five wind tur- bines would be needed to be installed on every km 2 , whether forest, parks, nature reserves, farmland, lakes, or residential areas and cities. It is also not taken into account that turbulence (waking effect) at reduced distances further reduces the efficiency of the systems and contributes to additional warming of the ground (Wu&Archer, 2020 [17]) Around 1 million km of high-voltage power lines – both underground and overhead – would need to be installed to connect them to the electrical grid, and access roads would need to be built for each wind turbine to facilitate construction, utilities and maintenance. What a successful step forward to saving the planet, and what a great step back to nature! A glance at the map of Berlin showing the governmental district (Fig. 6, right square) reveals that the distance from the Federal Chancellery to the Parliament (Bundestag) is approximately 700 meters. The future Chancellor will therefore be able to admire four to five wind turbines (magenta dots) in operation — as far as they are turning — on their way to Parliament. And this is the case for every German citizen on their way to work, in the office, during leisure times, or while falling asleep — always accompanied by infrasound. On average, there are four to five wind turbines per square kilometer of this country, if we want to rely solely on alterna- tive energy sources in the future. Where installations are not permitted, the number increases elsewhere. This renders moot the demand by politicians not to increase the current minimum distance between residential areas and wind farms (currently 400 m) to 1 km, in order to avoid further reducing the avail- able land for wind energy development. Germany will then be one giant wind farm with turbines in our front gardens. However, the turbulences generated by wind turbines leads not only to significant noise and infrasound emissions but also to reductions in efficiency and service life. For longer time, it was assumed that spacing equivalent to 6 to 10 times the rotor diameter was sufficient to largely avoid mutual interference; consequently, most wind farm operators opted for a spacing of seven times the diameter. For turbines in the 2.5 MW class with rotor diameters between 70 and 80 meters, this already results in a distance of about 500 meters. More recent recommendations and design concepts, however, suggest a spacing of 15 times the diameter to enhance turbine efficiency and longevity. Evidence shows that the additional vibrations caused by turbulence make many internal components — such as bearings, brakes, and rotating parts — more susceptible to breakage and catastrophic failure (DHC-Environmental Si-Tech Co. [18]). With such a recommended spacing, wind energy would not be able to secure even a quarter of Germany's energy supply.2. Estimate for Supply by Solar Panels
Further expansion of solar energy encounters similar limitations. For example, polycrystalline photovoltaic modules require a ground area of approximately 5 – 10 m² to generate 1 MWh over one year. Including access paths for maintenance, the required area increases slightly to 20 m²/MWh. To replace fossil fuels, accounting for 76.7 % of primary energy consumption, by solar power (see Fig. 2b), together with the already installed 3 % of solar capacity, this needs to generate 79.7 % of 2,914 TWh – equivalent to 2,322 TWh. It requires an area of 20 m² / MWh × 2,322 TWh = 46,440 million m 2 = 46,440 km 2 . Taking into account losses due to intermediate storage, also assumed to be 35 % with 10 % direct feed-in, solar power plants would require an area of 46,440 km 2 x (0.1 + 0.9 / 0.35) = 124,000 km². This is one-third of Germany's total land area. Vast areas of forest and farmland would have to be destroyed, with undeniable consequences for the microclimate. Solar panels are easily heating up to 60 °C or more, radiating a significant portion of the heat downwards and thus acting like a veritable greenhouse. Under such conditions a domestic agricultural sector capable of supplying its own population would no longer be viable. Such scenarios involving exclusively solar or wind power generation demonstrate how unrealistic it is to achieve self-sufficiency relying solely on these sectors. Even combining wind and solar power would require to occupy all usable land and natural areas. All this would be the logical consequence of the current, entirely unrealistic energy policy. There is hardly any alternative, except for energy imports from neighboring countries, which — except for Denmark — certainly do not constitute green energy; or we are dependent on imports of hydrogen and its derivatives from overseas. However, the German Government's strategy regarding the latter leaves significant questions unanswered (see also M. Löffler, 2024 [19]). Unfortunately, it is not yet clear how politicians in the EU and especially in Germany, demand- ing climate neutrality by 2045 or at least by 2050 and are claiming for a further expansion of green energy, intend to realistically implement this and that they are really aware of the resulting consequences. However, it is absolutely clear that without a reliable and sufficient energy supply, Germany and other countries that copy the German way will end up in anarchy: A collapsing economy and industry, rapidly rising unemployment, cold homes and workplaces, a collapsed traffic and transport system, dramatic consequences for agriculture and the health system, etc.V. Emissions Caused by Green Energy
In this context, the question also arises how truly green alternative energy sources are. Unfor- tunately, it is a common misconception that ‘renewable energies‘ produce no emissions. A re- liable assessment of emission savings must also account for the emissions generated during the manufacturing, operation, and disposal of wind turbines, solar installations, and batteries — even though these processes often take place out of sight at quarries, mines, or mineral extraction sites scattered across the globe.1. Material requirements
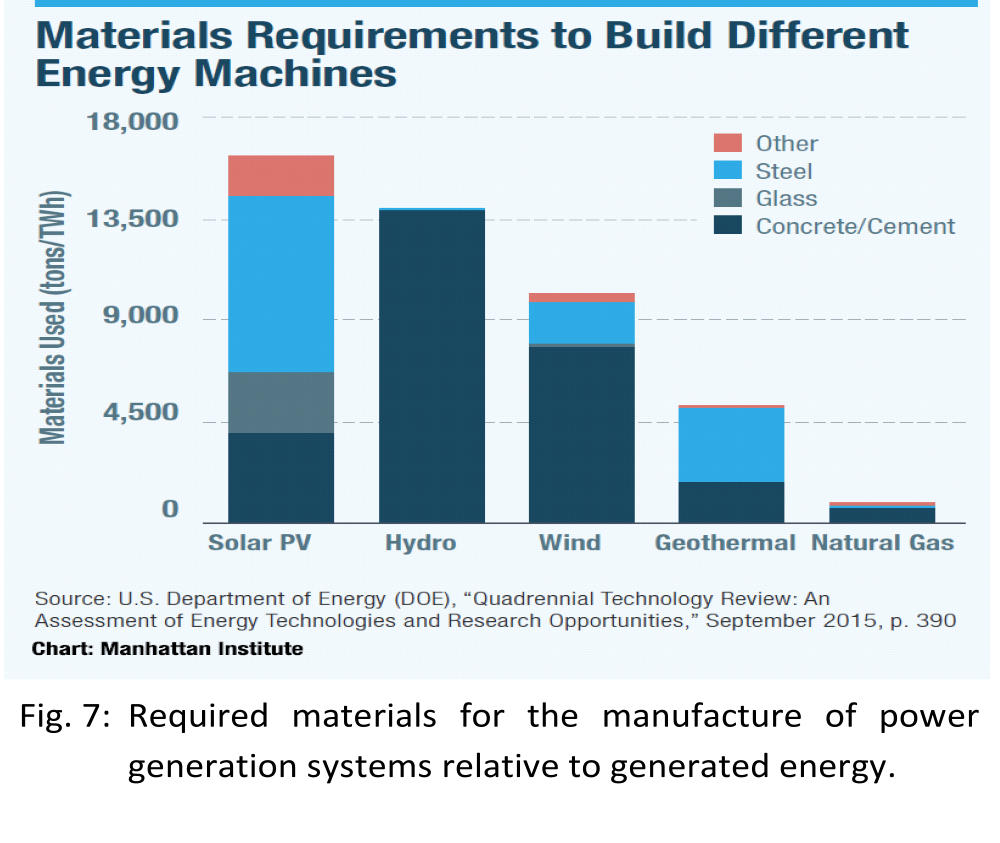
The fundamental difference compared to conventional power plants is that — relative to the energy a system generates — green technologies require not only significantly more land area but also a much greater input of materials and, consequently, a higher energy expenditure (see M.P. Mills, 2020 [20]). This is evident from a graph by the Manhattan Institute — based on data from the U.S. Department of Energy — showing that green technologies require at least ten times as much material. Solar installations top the list (Fig. 7). This becomes immediately apparent when, for instance, one considers replacing a single 100 MW natural gas turbine — itself roughly the size of a residential building and capable of generating enough electricity for 75,000 households — with wind turbines. Depending on the design of the wind turbines (ranging from 2 to 5 MW per unit), between 20 and 50 turbines would be required to match that rated capacity. However, since downtime and storage losses limit the power actually fed into the grid, to not more than about 8 % of the rated capacity, replacing the gas turbine would ultimately require between 250 and 620 wind turbines, depending on their size. Constructing such a "wind farm" requires — depending on the specific conditions — approxi- mately 300,000 tonnes of iron ore, 1 million tonnes of concrete, and 10,000 tonnes of glass- fiber composites. In addition to these conventional construction materials, there is a signifi- cantly higher demand for copper, cobalt, and rare earth elements; these typically occur in ores at concentrations well below 1 % and must be extracted from them. For example, producing one tonne of copper requires mining and crushing an average of 200 tonnes of copper ore, and separating it from rock and slag in smelters before electrolytic refining finally yields pure copper suitable for electrical engineering applications. Yet, before any mineral can be mined at all, an average of five tonnes of soil or rock must first be removed for every tonne of ore extracted. The average copper requirement for a 2 MW wind turbine (including infrastructure) is cited as 15 tonnes (Wind Fair [21]), which equates to approximately 7.5 tonnes per MW. For the entire wind farm, this amounts to 9,400 tonnes of copper (7.5 tonnes/MW ·100 MW/ 8 %); extracting this requires mining of about 2 million tonnes of copper ore and moving 10 million tonnes of overburden. Similar considerations apply to cobalt and rare earth elements, which are required in significantly smaller quantities for construction but often occur in even lower concentrations during extraction. The extraction and processing of all these materials rely almost exclusively on the use of fossil fuels. Energy payback time is a frequently cited metric for assessing a power plant's efficiency. It indicates the time required for a power plant to generate an amount of energy equal to that consumed during its production, transport, construction, and operation. For wind turbines, values ranging from 3 to 12 months are typically cited. Based on annual standard energy yield (approximately 20 % of rated capacity for wind turbines — meaning about 3.6 GWh for a 2 MW turbine), this equates to between 0.9 and 3.6 GWh. However, this calculation excludes the energy input required to extract and manufacture the materials; nor does it account for the construction of storage systems or the energy losses associated with conversion into hydrogen or methane and subsequent reconversion into electricity. If one also factors in the additional energy required for the complex, extensive electrical distribution grid, as well as decommissioning and disposal, the payback time approaches the scale of the wind turbines' service life — currently 20 years. After such a period, a wind farm typically requires renewal — hence, perhaps, the term "re- newable energies." While some high-quality materials can be recycled, significant material replacement and the use of conventional energy remain necessary for this process. Consequently, one cannot characterize this as a particularly favorable, emission-free technology when replacing a 100 MW gas turbine ultimately requires up to 620 wind turbines—plus storage and grid infrastructure—yet produces little more energy than was consumed during its entire creation. Furthermore, current projections indicate that by 2050, the volume of decommissioned solar panels—a large proportion of which cannot be recycled—will amount to double the tonnage of all current global plastic waste, alongside several million tons of non-recyclable plastics annually from retired wind turbine blades. Additionally, more than 10 million tons of batteries will become waste each year by 2030 [19]. Consequently, this perspective alone raises the question, how sensible it is shutting down a conventional power plant that operates with significantly higher efficiency—and thus emits less CO 2 —than the excavators and bull-dozers used in mining, foundation laying, or grid expansion. For both the environment and the climate, continued operation is a far less damaging option than mandating quotas for fuels generated from electricity.2. Biomass
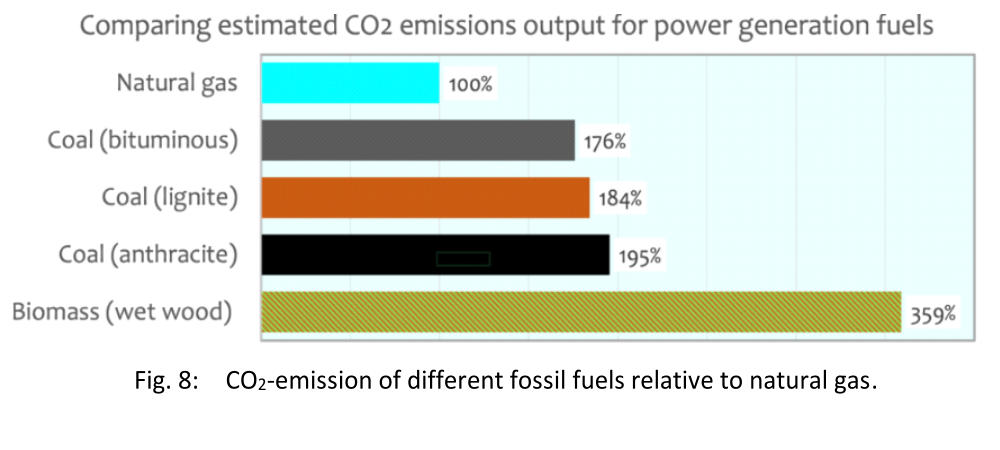
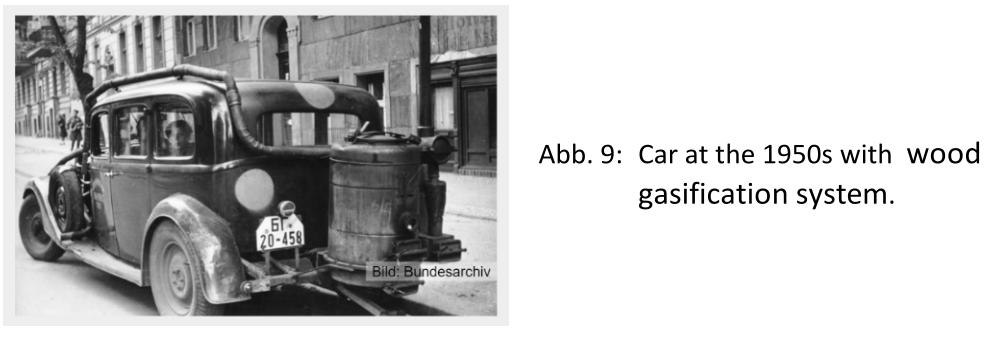
Attention should also be drawn to the paradox of wood biomass as a CO 2 -neutral energy source. Thanks to available subsidies, Germany has become the world’s largest market for wood pellets by sales volume. Between 1999 and 2008 alone, around 100,000 pellet heating systems were installed in private households. Coal-fired power plants are also being converted to run on pellets, leading to the felling of entire forests, as a single power plant unit requires up to 850,000 tonnes of wood annually. Such facilities are considered climate-neutral based on the premise that burning wood is merely part of the CO 2 cycle. It is undoubtedly true that trees destined for combustion have previously absorbed CO 2 from the atmosphere and thus do not release additional CO 2 into the environment in the way that burning coal or oil does. However, a comprehensive assessment must also take into account that, for an equivalent heating value, biomass generates twice as much CO 2 as coal and 3.6 times as much as natural gas (Fig. 8). The short-term release of these emissions and the slow regrowth of biomass—a process spanning 50 to 100 years during which CO 2 uptake is reduced—also play a role. Recent studies indicate that CO 2 uptake by the biosphere is significantly higher than previously assumed; they confirm that this increased uptake is primarily attributable to rising atmosphe- ric CO 2 concentrations (Haverd et al., 2019 [22]; see also Harde [7], Harde [8]). Although these power plants and heating systems now emit substantially more CO 2 than before, energy companies and homeowners are permitted to claim, they would produce reduced emissions. Similarly, cars equipped with wood gasification systems in the future (see Fig. 9) contribute to the greenhouse gas reduction quota for the transport sector, and their owners can even expect state subsidies for doing so. It is therefore legitimate to question the merit of subsidy programs and laws aimed at meeting emission quotas when they are virtually counterproductive to the intended goals.VI. Expected Costs of the Energy Transition
The current costs for promoting alternative energies, buying emission certificates and replacing the already shut-down nuclear power plants, as well as the many local restructuring measures, have already led to one of the highest electricity prices worldwide for industry and citizens.1. Electricity Prices
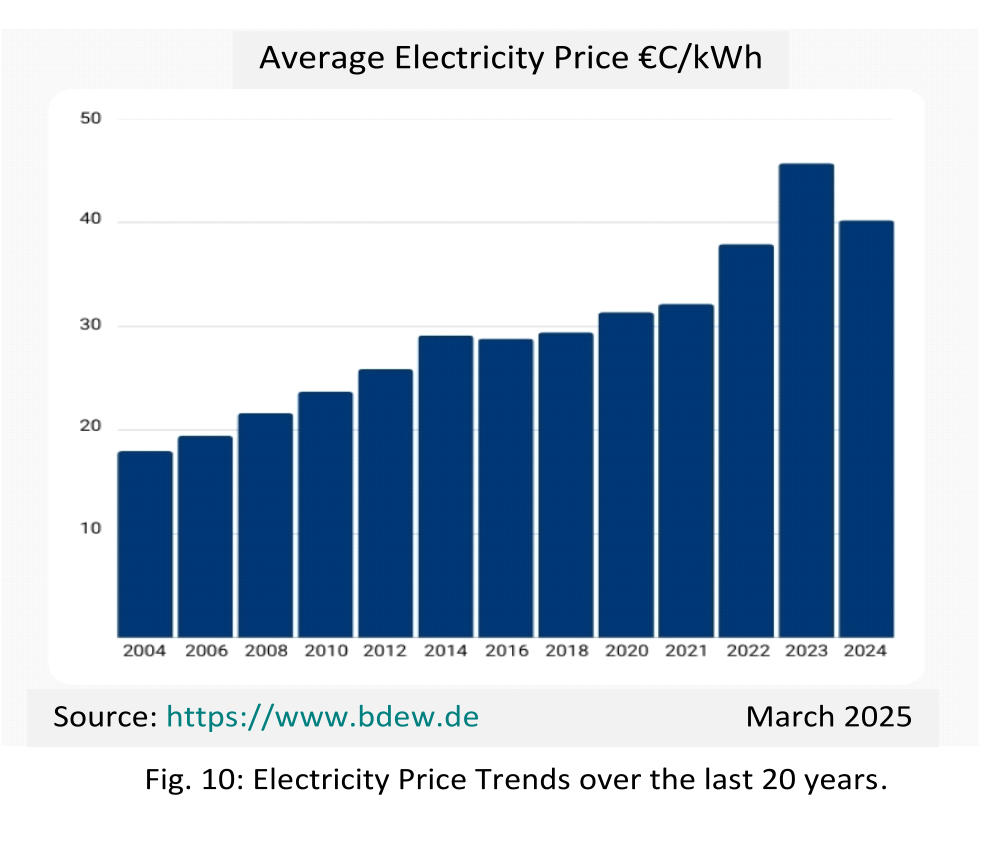
While the average electricity price for private households in Germany was 13.9 cents/kWh at the turn of the millennium, it rose steadily until 2023, when the German Government intro- duced five different new levies to finance the energy transition. By 2018, the price had already reached 29.4 cents/kWh, and in 2023 it hit an all-time height of 47 cents/kWh. Prices remained at a very high level of 40 cents/kWh in 2024 and 2025, and only with the beginning of 2026 did they fall back to 33 cents/kWh for existing customers and even to 24 cents/kWh for new customers (Strom-Report [13], Vergleich.de [23], all prices in €cents). The increase of the electricity price from 13.94 to 46.91 cents/kWh over 24 years corresponds to a rise of 240 %, or 10 % per year. The largest price jump occurred between 2022 and 2023, rising by 26 % from 37.14 to 46.91 cents/kWh . This price includes the costs of electricity generation, which now account for 53 %, network charges with all taxes and levies. Taxes, levies, and surcharges have more than doubled since 2000 (from 5.19 to 12.57 cents/kWh) and, in 2023, accounted for 27 % of the electricity price as part of the "government charges" cost category. Network charges made up 20 %, and the remaining 53 % went to the electricity supplier for providing the energy. Due to the impact of the Ukraine war, the phase-out of nuclear power and reduction of coal- fired power generation increased the energy costs by 79 % in 2023. This cost could not be significantly reduced by importing liquefied natural gas (LNG) as a replacement.2. Promotion of Alternative Energies
A significant portion of the total electricity generation costs is attributable to the promotion of alternative energies. With the introduction of the Renewable Energy Sources Act (EEG) in 2000 by the Red-Green Coalition, electricity customers primarily financed the expansion of alternatives through their electricity bills. This law guaranteed owners of photovoltaic or wind power plants compensation for every kilowatt-hour fed into the grid. The compensation rate set at the time of purchase or installation remained valid for a period of 20 years. Up to now this compensation was also guaranteed to an owner even when the electricity was not needed and there was overproduction, as increasingly occurs in the summer months with plenty of sunshine and wind, without available storage capacity. The surplus electricity was then ‘sold‘ abroad at no cost or even with additional payment, or the feed-in to the grid was limited (curtailment of individual plants), but this was done with full compensation for the operators, even for the electricity not actually generated. Since 2024, the feed-in tariff for new installations has been subject to a 1% reduction every six months; additionally, since 2025, the tariff is temporarily suspended during periods of nega- tive electricity prices on the stock exchange, though the 20-year term is extended accordingly (in 2025, this amounted to 575 hours). Starting in 2027, the government plans to completely abolish feed-in tariffs for systems with a capacity of less than 25 kWp; instead, they are to participate in direct marketing. With the further accelerated expansion of wind and solar power, such situations become more frequent. However, there are also extended periods where demand supply cannot be nearly met by these alternatives, necessitating the import of expensive electricity or its generation by conventional power plants. For stable grid operation, such power plants must be available in standby mode anyway, which equates to a redundant installation and significantly increased operating costs. The total outage of the Spanish and Portuguese grids at the end of April 2025 demonstrated the potential consequences of an insufficiently stabilized grid. In April 2022, following the outbreak of the war in Ukraine, the government decided to abolish the EEG surcharge in order to cap the sharply rising electricity prices through state support and protect electricity customers from further increases. At that time, gas imports from Russia fell and energy prices rose rapidly. Operators of alternative energy plants continue to receive their compensation payments for overproduction, but since July 1, 2022, these payments have been financed by taxpayers' money. For the year 2025, the federal government paid 16.5 billion € in tax revenue into the EEG account. This is shown in the overview of revenues and expenditures according to the Energy Promotion Act (Energieförderungsgesetz) provided by the portal Netztransparenz.de [24]. At the same time, over this period, the remuneration for fed-in or notional electricity to owners of alternative energy plants amounted 18.5 billion €, of which 89 % (including grid expansion charges) was subsidized by tax revenue – money that is now missing from the federal budget without further borrowing. With electricity prices, already the highest in the world – even before the war in Ukraine – these government subsidies currently result in additional costs of 33 € per month for each of Germany's approximately 42 million taxpayers (16.5 billion € / 12 months / 42 million taxpay- ers). Politicians constantly try to convince us that alternative energy is significantly cheaper than conventional energy because the Sun and wind don't send bills. Unfortunately, they overlook the fact that an ideologically driven, rather than market-oriented energy transition, which cannot be achieved without secure storage technology or reliable backup power, will result in considerably higher overall costs for consumers and taxpayers. It is also clear that the government's decisions to impose a further CO 2 tax, will increase the burden on citizens. Starting in 2021, the levy was 25 €/t CO 2 ; since January 1, 2024, it has been 45 €/t, and from 2025 onward, it will be 55 €/t. Some political parties and environmental or- ganizations consider this far too low, and a further significant increase to 180 €/t is already being intensively discussed. While the federal government uses a considerable portion of the revenue to finance the costs of the EEG surcharge, heating costs, transportation costs, and the operation of gas-fired power plants for standby and backup operation also drive the costs even higher.3. Expected Costs for Zero Emissions
To achieve the planned energy transition, a study from 2017 (Ausfelder et al. [25), commis- sioned by the German Federal Government and conducted by various German institutes, indicates that a 90 % reduction in CO 2 emissions by 2050 will require additional costs of approximately 4.5 trillion €, and a 100 % reduction, as stipulated in the German Climate Agreement, is expected to require a further 3 trillion €. Together, this is almost three times the current national debt of the Federal Republic of Germany, which accumulated after World War II, and is more than fourteen times the planned 2026 national budget of 525 billion €. Without a further increase in current debt, which is already placing an irresponsible burden on future generations (a state cannot live on credit forever unless it aims for national bankruptcy and currency reform), these extra costs for implementing the energy transition must be borne by the taxpayer. For the approximately 40 million households, this will result in an additional burden of 188,000 € per household, or 520 € per month per household over 30 years (excluding additional inter- ests), on top of the already high energy costs. To achieve climate neutrality by 2035, as demanded by "Fridays for Future" and also by the Green Party at their conference on November 17, 2019, each household would have to bear an additional burden of 1040 € per month (see also Vahrenholt & Tichy [26]). This is what real- world relief for low-income earners and an affordable energy supply for the future would look like. These national costs for an energy transition must be added to the international commitments made by industrialized countries. To date, wealthy industrialized nations have pledged at least 100 billion $ (93 billion €) per year to promote climate protection and adaptation in countries of the Global South. Since 2022, Germany has already contributed 6.4 billion € to this effort. According to estimates by some experts, at least one trillion dollars per year will be necessary for this in the future; some calculations even reach 2.4 trillion dollars per year. The COP29 World Climate Summit in Baku in 2024 called for an compensation fund of at least one trillion US dollars per year for developing countries, to which industrialized nations, but also wealthy emerging economies such as China and the Gulf States, should contribute. Schoolers who demonstrate on the streets because it's "action" and a great "event," without knowing what they're really demonstrating for, might be forgiven for demanding zero emiss- ions and the resulting costs. But politicians, who are undoubtedly easily misled or deliberately misled by special interest groups, including scientific representatives and organizations, should certainly re-examine their political decisions; after all, they are responsible for the consequences of their policies. However, all these pending expenditures are by no means a guarantee of a future emission- free supply of sufficient and reliable energy, as is naturally expected by an industrialized nation. Initial insights are now emerging from the two largest European oil companies, Shell and BP, which are attempting to scale back their green initiatives of recent years and con- centrate on their core business. For example, BP put a US onshore wind portfolio worth around 2 billion $ up for sale, and an offshore project worth 1.1 billion $ has already been written off (Blackout News, 2024 [27]).VII. The Climate Delusion
An energy transition away from fossil fuels to so-called clean energy is based on the idea that humanity can control the climate and thus save the world with its CO 2 emissions. This is an absolute delusion. Ever since weather and therefore climate have existed on Earth, they have been determined by internal and external natural influences. We would have to control solar activity or the Earth's orbit to significantly influence our climate. So far, there is no real evidence for the hypothesis of exclusively anthropogenic global warm- ing. On the contrary, there are many indications that the biosphere develops significantly better at higher CO 2 concentrations in the atmosphere and at slightly higher temperatures (Wong [28]; Morrison & Lawlor [29]; Zhu et al. [30]). A comprehensive compilation on the importance of carbon dioxide for our lives and survival can be found on the CO2 Coalition website [31]. Nevertheless, large parts of our population, the media and especially our political represen- tatives are now being indoctrinated by some environmental organizations who, either of ideo- logical conviction, political interests or against their better judgment, have become fixated on spreading: The only way to save the Earth is to stop all CO 2 emissions. This is based on extensive speculation and hypotheses, - regardless of the unimaginable burdens on consumers and industry, - regardless of the impact on nature and - regardless of the catastrophic consequences for the economy and social system. At the same time, countries like China or India are replacing our saved CO 2 emissions within a few months with their ever-increasing rates. A veritable climate hysteria has developed, which is being spread worldwide by the media, politicians, and now also by our educational institutions. It is the belief that we live in a world threatened by what is perhaps the most important molecule that nature has given us on Earth besides water: the carbon dioxide molecule (see CO2 Coalition [31] and Jay Lehr [32]). Instead of being grateful for this gift, which makes life, as we know it, possible on our planet, some people have chosen to demonize CO 2 , clearly for political reasons. Nearly half the people living in industrialized countries now believe the narrative of a planet in danger, and they de- mand a changed economic and social system. They fail to realize, however, that this would simultaneously mean abandoning a secure and affordable energy supply, which is what made our current standard of living possible—a standard so many people in developing counries yearn for. However, the alleged strong influence of CO 2 on our climate, with its consequences of a dramatic temperature increase and unprecedented sea-level rise, as regularly promoted by the IPCC, has led to serious doubts about the IPCC's claims among a growing number of scientists and climate experts (see CLINTEL 2024 [33]). Most scientists do not dispute a small anthropogenically enhanced greenhouse effect, but rather its magnitude and its dramatic influence on our climate. It would be an irresponsible environmental and climate policy to further ignore reputable, peer-reviewed scientific publications that demonstrate a significantly smaller human impact on the climate than previously assumed, while simultaneously phasing out a well-functioning conventional energy supply without providing an adequate replacement. Our economy and quality of life depend critically on a reliable, sufficient, and affordable energy supply. This cannot be replaced by millions of wind turbines that destroy our natural environment and shred trillions of birds and insects. Also this cannot be replaced by solar panels that would cover one third of our country and destroy it. At least, contrary to the German approach, at the last UN climate conference, 20 nations committed to tripling global nuclear energy capacity by 2050, and at a meeting of the Inter- national Atomic Energy Agency (IAEA) in Brussels on March 21, 2024, 35 states pledged their support for nuclear energy.References
1. Intergovernmental Panel on Climate Change (IPCC): https://www.ipcc.ch/ 2. IPCC Special Report 2018: https://www.ipcc.ch/sr15/download/ 3. Paris Agreement - December 2015: https://treaties.un.org/doc/Treaties/2016/02/20160215%2006- 03%20PM/Ch_XXVII-7-d.pdf 4. Kyoto-Protocol 1997 https://www.bmwi.de/Redaktion/DE/Artikel/Industrie/klimaschutz-kyoto-protokoll.html https://unfccc.int/resource/docs/convkp/kpeng.pdf 5. H. Harde, 2014: Advanced two-layer climate model for the assessment of global warming by CO 2 , Open Journal of Atmospheric and Climate Change, vol. 1, no. 3, pp. 1–50, ISSN (Print): 2374-3794, ISSN (Online): 2374-3808 https://web.archive.org/web/20160429061756/http://www.scipublish.com/journals/ACC/papers/downl oad/3001-846.pdf 6. H. Harde, 2017: Radiation Transfer Calculations and Assessment of Global Warming by CO 2 , International Journal of Atmospheric Sciences, Volume 2017, Article ID 9251034, pp. 1-30, https://doi.org/10.1155/2017/9251034 7. H. Harde, 2017: Scrutinizing the carbon cycle and CO 2 residence time in the atmosphere, Global and Planetary Change 152, pp. 19-26. http://dx.doi.org/10.1016/j.gloplacha.2017.02.009, Free download of the Manuscript 8. H. Harde, 2019: What Humans Contribute to Atmospheric CO 2 : Comparison of Carbon Cycle Models with Observations, Earth Sciences. Vol. 8, No. 3, pp. 139-159. http://doi.org/10.11648/j.earth.20190803.13 9. H. Harde, 2025: Atmospheric CO 2 : What Physics Dictates, Contribution on the 6 th Nordic Climate Conference, Oslo-Gardermoen, Science of Climate Change, Vol. 5.4, pp 66 - 76, https://doi.org/10.53234/scc202511/12 10. D. P. van Vuuren, B. C. O’Neill, C. Tebaldi et al., 2026: The Scenario Model Intercomparison Project for CMIP7 (ScenarioMIP-CMIP7), Geoscientific Model Development, Vol. 19, pp. 2627–2656, https://doi.org/10.5194/gmd-19-2627-2026 11. Federal Climate Change Act, https://www.gesetze-im-internet.de/ksg/BJNR251310019.html 12. Federal Ministry for Economic Affairs and Energy, 2026: Development of renewable energies in Germany in 2025, graphs and diagrams using current data from the Working Group on Renewable Energy Statistics (AGEE-Stat), Renewable energies in Germany 13. Electricity report: https://strom-report.com/windenergie/ http://strom-report.de/strom preise/strompreisentwicklung/ 14. German Wind Energy Association (BWE): https://www.wind-energie.de/themen/zahlen-und-fakten/ 15. Breaking Lab, Jakob, 2023: Electricity supply as a bottomless pit, approx. 2.7 billion € lost through redispatch in 2022, https://www.youtube.com/watch?v=5PQeceJnmfM 16. Outdoor Chiemgau, 2024: Crazy Friday in the power grid, September 29, 2024: 145 million € in costs due to the energy transition, https://www.youtube.com/watch?v=i9gn3R7rvTM 17. S. Wu, CL Archer, 2020: Near-Ground Effects of Wind Turbines: Observations and Physical Mechanisms, Monthly Weather Review, December 2020, https://doi.org/10.1175/MWR-D-20-0186.1 18. DHC-Environmental Si-Tech Co. Ltd: https://www.dhceversaving.com/de/wind-turbine-spacing-how-far-apart-should-they-be. 19. M. Löffler, 2024: Hydrogen from abroad: Is Germany's energy transition in danger of failing? Epoch Times October 2024 Hydrogen from abroad: Is Germany's energy transition in danger of failing? (epochtimes.de) 20. M. P. Mills, 2020: Mines, Minerals, and "Green" Energy: A Reality Check, Energy & Environment: Regulations, July 2020, Manhattan Institute https://media4.manhattan-institute.org/sites/default/files/mines-minerals-green-energy-reality- checkMM.pdf 21. Windmesse: https://w3.windmesse.de/windenergie/news/23183-windenergieanlagen-setzen-auf-zuverlassige- und-verfugbare-materialien 22. V. Haverd, B. Smith, J. G. Canadell, M. Cuntz, S. Mikaloff-Fletcher, G. Farquhar, W. Woodgate, P. R. Briggs, C. M. Trudinger, 2020: Higher than expected CO 2 fertilization inferred from leaf to global observations, Glob Change Biol. 2020; 26: pp. 2390–2402. https://doi.org/10.1111/gcb.14950 23. Vergleich.de: Society for Consumer Information https://www.vergleich.de/strompreise.html 24. Network transparency, 2025: Current data on revenues and expenditures according to the Energy Promotion Act (EnFG) https://www.netztransparenz.de/de-de/Erneuerbare-Energien-und- Umlagen/EEG/Transparenzanforderungen/EEG-Konten%C3%BCbersicht. 25. Ausfelder et al. (Hrsg.), 2017: Sektorkopplung - Untersuchungen und Überlegungen zur Entwicklung eines integrierten Energiesystems, Schriftenreihe Energiesysteme der Zukunft, München 2017, ISBN: 978-3-9817048-9-1. https://energiesysteme-zukunft.de/publikationen/analyse/sektorkopplung/ 26. Fritz Vahrenholt, Ronald Tichy: 7.600 Milliarden fürs Klima, Tichys Einblick, 20.8.2019 https://www.tichyseinblick.de/daili-es-sentials/7-600-milliarden-fuers-klima/ 27. Blackout News, September 24, 2024: https://blackout-news.de/aktuelles/bp-stieg-aus-erneuerbaren- energien-aus-und-leg-focused-auf-kerngeschaeft-mit-oel-und-gas/ 28. S. C. Wong, Elevated atmospheric partial pressure of CO 2 and plant growth, Oecologia (Berl.) 44, pp. 68-74 (1979), https://link.springer.com/article/10.1007/BF00346400 29. J. I. L. Morison, D. W. Lawlor, 1999: Interactions between increasing CO 2 concentration and tempera- ture on plant growth, Plant, Cell and Environment 22, pp. 659–682. https://onlinelibrary.wiley.com/doi/full/10.1046/j.1365-3040.1999.00443.x 30. Zaichun Zhu et al., 2016: Greening of the Earth and its drivers, Nature Climate Change 6, pp. 791–795, https://www.nature.com/articles/nclimate3004 NASA 2016, CO 2 is making Earth greener - for now, https://climate.nasa.gov/news/2436/co2-is-making-earth-greenerfor-now/ 31. CO 2 Coalition, established in 2015 for the purpose of educating thought leaders, policy makers, and the public about the important contribution made by carbon dioxide to our lives and the economy https://co2coalition.org 32. Jay Lehr: The Climate Delusion, Acceptance speech given at ICCC 13 on July 25, 2019. https://www.youtube.com/watch?v=iAmMatOT5Ac 33. M. Crock, A. May, 2024: The Frozen Climate Views of the IPCC - An Analysis of AR6, CLINTEL, https://clintel.org/the-frozen-climate-views-of-the-ipcc/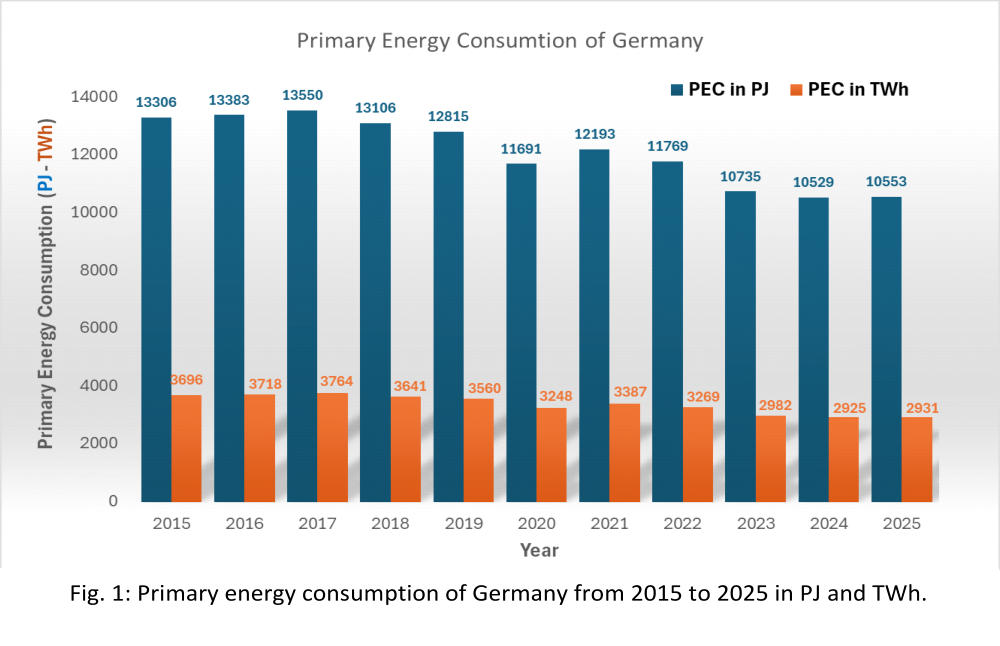















































Physics & Climate










;void;)
;void;)