
b) Climate Sensitivity
Although in recent years great progress has been achieved in climate sciences, explanations of the observed global warming over the last century, in particular the anthropogenic contribu- tions to this warming are still quite contradictorily discussed. So, calculations of the equilibri- um climate sensitivity (ECS) as a key parameter and measure for the Earth's temperature in- crease at doubled CO 2 concentration in the atmosphere diverge by more than a factor of 20 starting at about 0.4°C and ending at more than 8°C. The previous assessment report AR5 [1] of the IPCC specified this quantity only within a wider range of 1.5°C to 4.5°C without a best estimate, while in the last report AR6 [2] a narrower range from 2.5°C to 4°C (high confidence) with a best estimate of 3°C is presented. At the same time classifies the IPCC the human influence on our climate as extremely likely to be the dominant cause of the observed warming since the mid-20th century. Since the ECS is one of the most important measures for climate predictions, it is necessary to understand and to discover the large discrepancies between different accounting schemes ap- plied for this quantity.Spectral Calculations
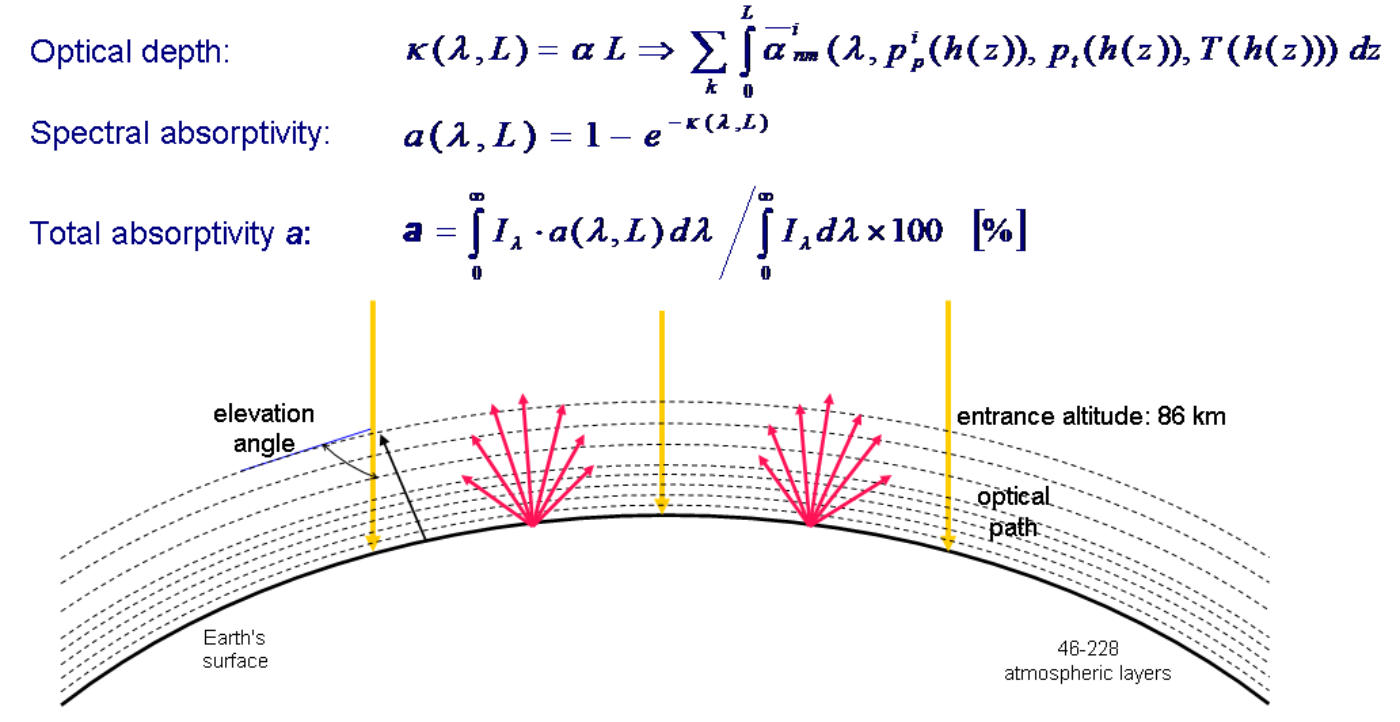
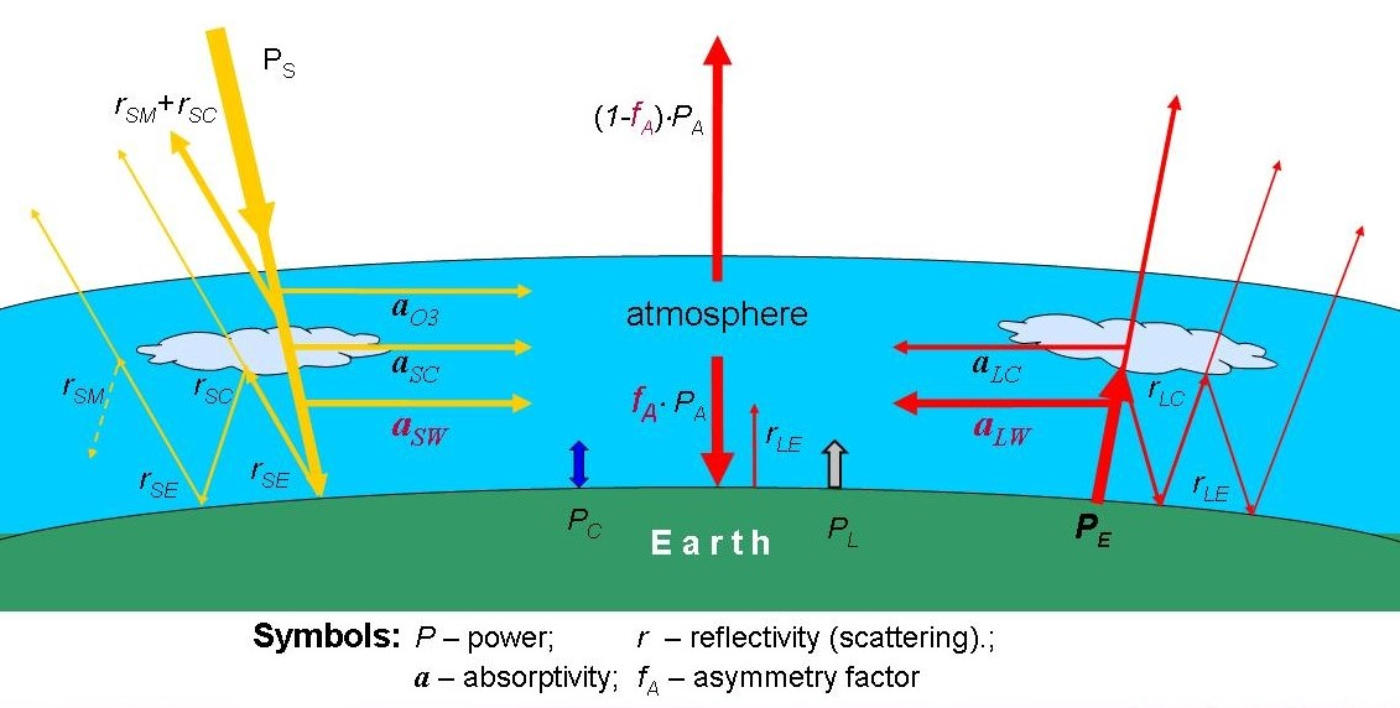
Therefore, it seemed appropriate to retrace the main steps of the IPCC's preferred accounting scheme and to compare this with own studies, which are based on extensive spectral calcula- tions for the short wave (sw) absorptivity a SW of the solar intensity I S in the atmosphere, the long wave (lw) absorpti- vity a LW of the terrestrial in- tensity I T and the re-emitted power P A of the atmosphere by GH-gases with a fraction f A in downward and 1-f A in up- ward direction (Harde 2011 [3]; 2013 [4]; 2014 [5]; 2017 [6]; 2019 [7]). These calculations were performed with almost 900,000 lines of the GH-gases CO 2 , water va- por, methane and ozone, this for 228 sublayers of the atmosphere accounting for the total and partial pressure changes of the gases and the lapse rate, this for 14 different CO 2 concen- trations, different cloud covers and three climate zones.Radiative Forcing and Absorptivities
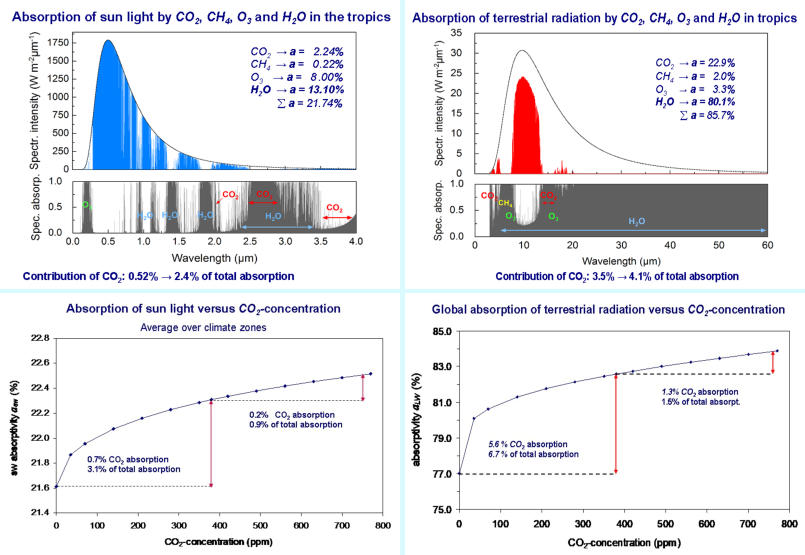
The transmission spectra and the spectral absorptivities for the sw and lw radiation show strong saturation over the path lengths and a significant overlap of the CO 2 lines with water vapor. Both effects contribute to fast saturation of the absorptivities with increasing CO 2 concentration, which can well be approximated by logarithmic graphs. From these calculations we derive the radiative forcing DF 2xCO2 as important parameter for the ECS-calculation. It specifies the reduced upwelling lw radiation at the top of the atmosphere (TOA) at doubled CO 2 concentration in the atmosphere. As the absorptivities and thus the ra- diative forcing are ascending almost logarithmically with increasing CO 2 concentration, it makes no bigger difference to calculate a CO 2 doubling from 280 to 560 ppm or from 380 to 760 ppm.Advanced Two-Layer Climate Model
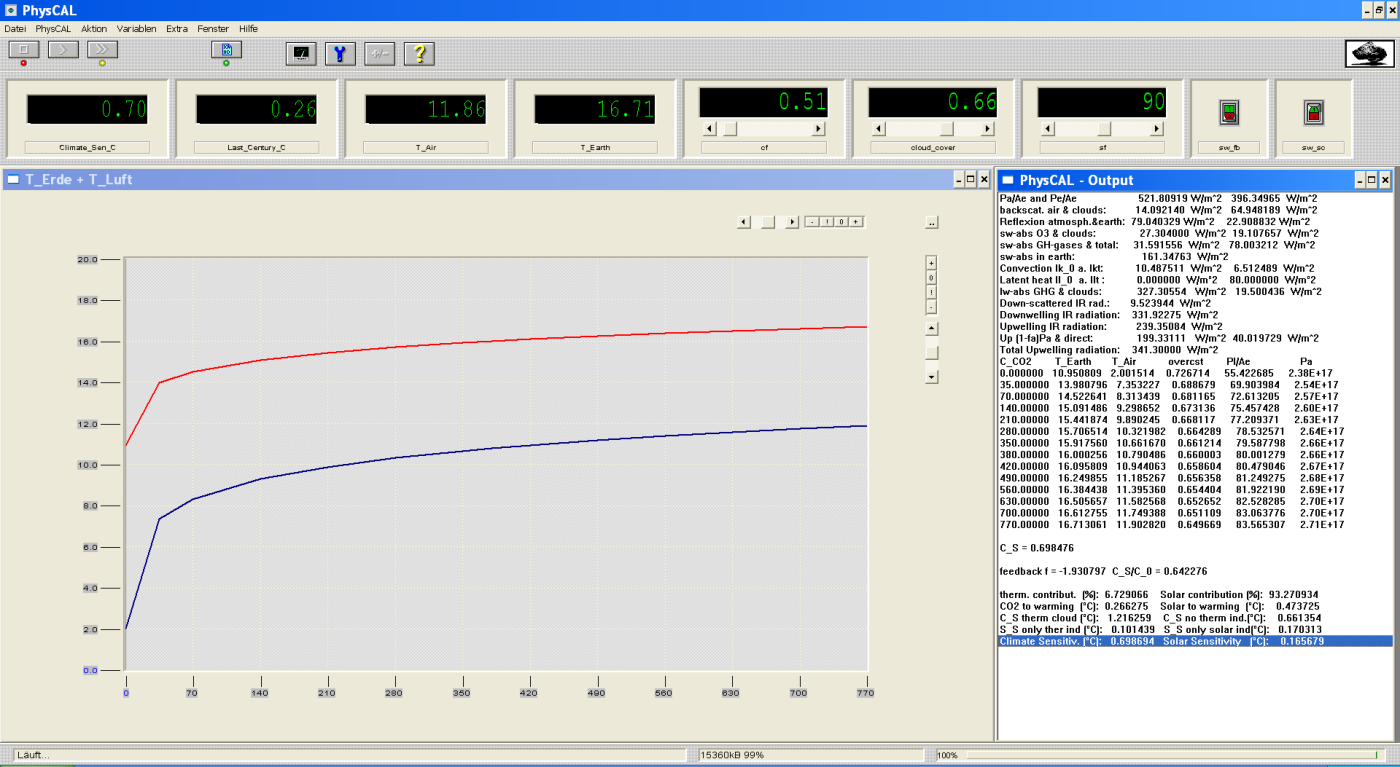
Instead considering the radiative forcing at doubled CO 2 concentration an even improved de- scription and characterization of EASy to GHG changes can be derived from the primary quan- tities a SW , a LW and f A , which are used as the key parameters in our advanced two-layer climate model (Harde 2014 [5]; 2017 [6]) to determine the ECS-value as temperature increase at doubled CO 2 . This two-layer climate model is especially appropriate to simulate the influence of increasing CO 2 concentrations on global warming as well as the impact of solar variations on the climate. It describes the atmosphere and the ground as two layers acting simultaneously as absorbers and Planck radiators, and it includes additional heat transfer between these layers due to con- vection and evaporation. The model also considers sw and lw scattering processes at the at- mosphere and at clouds as well as all common feedback processes like water vapor, lapse rate and albedo feedback, but additionally takes into account temperature dependent sensible and latent heat fluxes as well as a temperature induced and solar induced cloud cover feedback. This model is implemented on a Visual-Pascal-Platform (PhysCal) which runs under Win- dows (see screen shot). It solves the energy- and radiation-balance at the Earth’s surface and at TOA and from this calculates and plots the Earth’s surface temperature T E (red graph) and the lower tropospheric temperature T A (blue graph) as a function of the CO 2 concentration. The difference of T E (760 ppm) - T E (380 ppm) gives directly the ECS, in this case 0.7°C (left display).Feedbacks
Such simulations reproduce the basic ECS-value (without feedback processes), as specified by the IPCC, within a few %. Significant differences, however, are observed with the different feedback effects included. While the lapse rate and albedo influence were adopted from literature, the water vapor feedback is derived from the sw and lw absorptivity calculations performed for three climate zones with different surface temperatures and humidity. These calculations give a positive feedback with an increase of not more than 14 % (Harde 2017 [6]), whereas in AR5 [1] the IPCC emanates from an incline of 100% and in AR6 [2] even from 122%, which after all is 9x larger than our result. Since our calculations indicate that with increasing CO 2 concentration the air temperature is less rapidly increasing than the surface temperature, the sensible heat flux at the bound of both layers rises with the concentration. As a consequence more thermal energy is transferred from the surface to the atmosphere. Similarly, with increasing surface temperature also eva- poration and precipitation are increasing with the ground temperature. Both these effects con- tribute to negative feedback and are additionally included in the simulations. While the respec- tive contribution due to sensible heat rapidly declines with increasing cloudiness, evaporation feedback with an attenuation of 44 % is the primary stabilizer of the whole climate system. All the more it is surprising, that the IPCC obviously did not consider this important effect in AR6.Clouds
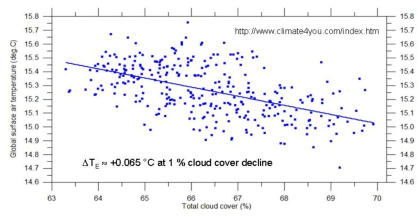
A special situation is found for the influence of clouds on the radiation and energy budget. From global cloud observations within the International Satellite Cloud Climatology Project (ISCCP) over a period of 27 years it is de- duced that the global mean temperature is increasing with decreasing cloud cover. However, it is not clear, if a lower cloud cover is the consequence of the increasing temperature, or if the cloud cover is in- fluenced and at least to some degree con- trolled by some other mechanism, particu- larly solar activities. In the first case a strong amplifying Temperature Induced Cloud Feedback (TICF) had to be considered, this for the climate sensitivity ECS as well as for a respective solar sensitivity SS (surface temperature response to a solar anomaly of 0.1 %), whereas in the other case TICF would not exist for both sensitivities and only a Solar Induced Cloud Feedback (SICF) had to be included.Model Simulations for CO
2
- and Solar Influence
A deliberate approach which mechanism really controls the cloud cover, is derived from model simulations, which additionally include the solar effect and compare this with the measured temperature increase over the last century. These simulations show that the observed global warming can best be explained, when a temperature feedback on clouds only has a minor influence (less than 10 %). Otherwise the calculated warming would be larger than observed, or TICF would have been overestimated.Results
With a solar anomaly of 0.26 % over the last century and dominating SICF we deduce a CO 2 climate sensitivity of ECS = 0.7°C and a solar sensitivity of ESS = 0.17°C. The increase in the Total Solar Irradiance (TSI) over 100 years together with the dominating SICF then contributes to a warming of 0.47°C (64 %) and the 100 ppm increase of CO 2 over this period causes addi- tional 0.27°C (36 %) in good agreement with the measured warming and cloud cover. Altogether, we find that the positive feedbacks, originating from clouds, water vapor and albe- do are even overcompensated by lapse rate and evaporation feedback. Particularly clouds have two stronger opposing effects on the energy balance, which can neutralize each other or even have an overall attenuating impact on the ECS, dependent on the mechanisms respon- sible for cloud changes. From these studies we conclude, that all constraints can best be explained by a cloud feedback mechanism, which is dominated by the solar influence, while thermally induced contributions only should have minor influence. But even for the worst case assuming maximum TICF and a larger global warming over the last century than observed, the ECS would not exceed 1.2°C. For our more detailed investigations considering the simultaneous impact of CO 2 and solar forcing on global warming and a direct comparison of the calculations with observations over the last 150 years, see: e) Solar InfluenceReferences and Publications
1. Fifth Assessment Report (AR5) of the IPCC, 2013: Climate Change 2013, The Physical Science Basis, Contribution of Working Group I to the Fifth Assessment Report of the Intergovernmental Panel on Climate Change [T. F. Stocker, D. Qin, G.-K. Plattner et al. (Eds.)], Cambridge University Press, New York, NY, 2014, https://www.ipcc.ch/report/ar5/wg1/ 2. Sixth Assessment Report (AR6) of the IPCC, 2021: Climate Change 2021: The Physical Science Basis, Contribution of Working Group I to the Sixth Assessment Report of the Intergovernmental Panel on Climate Change [Masson-Delmotte, V. et al. (eds.)]. Cambridge University Press. https://www.ipcc.ch/report/ar6/wg1/downloads/report/IPCC_AR6_WGI_TS.pdf 3. H. Harde, 2011: Was trägt CO 2 wirklich zur globalen Erwärmung bei? Spektroskopische Untersuchungen und Modellrechnungen zum Einfluss von H 2 O, CO 2 , CH 4 und O 3 auf unser Klima, Books on Demand, Norderstedt 2011, ISBN: 9 783842 371576. https://www.amazon.de/tr%C3%A4gt-wirklich-globalen-Erw%C3%A4rmung- Spektroskopische/dp/3842371578 4. H. Harde, 2013: Radiation and Heat Transfer in the Atmosphere: A Comprehensive Approach on a Molecular Basis, International Journal of Atmospheric Sciences (Open Access), vol. 2013, http://dx.doi.org/10.1155/2013/503727 5. H. Harde, 2014: Advanced two-layer climate model for the assessment of global warming by CO 2 , Open Journal of Atmospheric and Climate Change, vol. 1, no. 3, pp. 1–50, 2014, ISSN (Print): 2374-3794, ISSN (Online): 2374-3808 https://web.archive.org/web/20160429061756/http://www.scipublish.com/journals/ACC/papers/download/30 01-846.pdf 6. H. Harde, 2017: Radiation Transfer Calculations and Assessment of Global Warming by CO 2 , International Journal of Atmospheric Sciences, Volume 2017, Article ID 9251034, pp. 1-30, https://doi.org/10.1155/2017/9251034 7. H. Harde, 2019: Wie schädlich ist CO 2 wirklich für unser Klima? Contribution on EIKE-Blog, 15. 02. 2019, https://www.eike-klima-energie.eu/2019/02/15/wie-schaedlich-ist-co2-wirklich-fuer-unser-klima/ Download as PDF-File, in GermanConferences
1. H. Harde, How much CO 2 really contributes to global warming? Spectroscopic studies and modelling of the influence of H 2 O, CO 2 and CH 4 on our climate, Geophysical Research Abstracts, Vol. 13, EGU2011-4505-1, 2011 , EGU General Assembly 2011. 2. H. Harde, Was trägt CO 2 wirklich zur globalen Erwärmung bei? Talk on Symposium "Energie und Klima - Ein Blick in die Zukunft", University Erlangen-Nürnberg together with VDI/VDE, November 2012. Download contributions under: https://opus4.kobv.de/opus4-fau/frontdoor/index/index/docId/3718. 3. H. Harde, How much CO 2 and also the Sun contribute to global warming, Conference on 'Basic Science of a Changing Climate', 7.- 8. September 2018, Porto, Portugal. 4. H. Harde, Was tragen CO 2 und die Sonne zur globalen Erwärmung bei? 12th International EIKE Klima- und Energiekonferenz, and 13th International Conference on Climate Change (ICCC-13), Munich, 23. a. 24. November, 2018, Videos: https://www.youtube.com/watch?v=ldrG4mn_KCs&feature=youtu.be 12. IKEK am 23. und 24.11.18 Hermann Harde – Wieviel tragen CO2 und die Sonne zur globalen Erwärmung bei?

Physics & Climate