COVID-19 Simulations with an Expanded SIR-Model
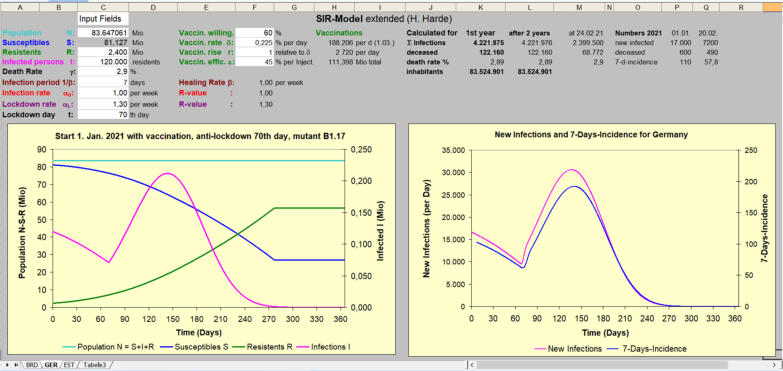
At the beginning of an epidemic typically an exponential spread of the disease or infection occurs, which means that hospitals can quickly become overloaded . The growth essentially depends on the transmission rate and the duration of an infection. To reduce the spreading speed of Corona, consequently in almost all countries of the world more or less radical measures like mask duty, contact restrictions, curfews or even total lock- downs were applied. To find the most acceptable ways and the best decisions during an epidemic or even pandemic mathematical models can help to better understand the exponential growth under different conditions and disposed measures. The Robert Koch Institute also uses computer models for influenza simulations and now for COVID-19 to consult health departments and politicians about an expected spread of the virus. This can answer questions like: - What is the maximum number of people infected at the same time and - when will this be? - What is the proportion of the population that will be infected in the worst case? - What can be useful measures to reduce the spread? - What is the influence of vaccination and what vaccination readiness is required? - How many deaths have to be expected depending on the measures? First mathematical models go back to the work of Ogilvy Kermack and Anderson Gray McKandrick in the 1927 [1], who had developed the Susceptible-Infected-Removed Model (SIR- model), which got its name from the grouping of the population in Susceptible Individuals (S), Infected Individuals (I) and Resistant Individuals (R) after an infection. Despite this comparatively simple model they could well model the data of a plague epidemic in Bombay in 1905-06. The following considerations are based on the general SIR model, which is used to simulate the COVID-19 pandemic, but which has been expanded to include some additional functions and calculations. This includes: - Consideration of the death rate and display of the total number of deceased at the end of the calculation period, - Impact of vaccinations under the influence of the population's willingness to vaccinate, - Lock-down simulation with a reduced infection rate, - Simulation of virus mutations with changed infection or incubation time. All calculations were done with an Excel spreadsheet program, which can be downloaded from this web-site together with a description of the theoretical background and a manual for executing own simulations. The calculations are displayed as graphs for the total population (N = S+I+R) and the three groups Susceptibles (S), Infected (I) and Resistants (R) over time in the left diagram, the New Infections per Day and the 7-Days-Incidence are shown on the right. COVID-19 Calculations using the SIR-Model H. Harde, March 2021 Download-English, Download-German, Excel-FileReferences
1. O. Kermack, A. G. McKendrick, A contribution to the mathematical theory of epidemics, Proc. Roy. Soc. A, Band 115, 1927, S. 700–721 2. Michael Li, An introduction to mathematical modeling of infectious diseases, Springer, 2018, Abschnitt 2.1, Kermick-McKendrick-Model.Contact:
Prof. Dr. Hermann Harde Helmut-Schmidt-University Holstenhofweg 85 22043 Hamburg, Germany Email: harde@hsu-hh.de Web: https://hharde.de Last update: October 21, 2025


Physics & Climate


