


Physics & Climate
a) Greenhouse Effect
Preliminary Comments
Fossil fuel emissions are made responsible for a climate emergency with catastrophic conse- quences for our planet, when worldwide anthropogenic emissions are not rapidly stopped. The basis of these forecasts is the atmospheric Greenhouse Effect (GHE), which goes back to Jean-Baptiste Joseph Fourier in 1824 [1], who was studying the Earth's energy budget to ex- plain the surface temperature. He assumed that the atmosphere is acting similar to a glass window, transparent for the solar radiation but blocking the Infrared (IR)-Radiation, emitted from the ground. Heat exchange with the environment by convection or heat conduction was largely neglected in this model. However, up to now even many climate experts do not care or try to understand, how green- house gases (GH-gases) are really affecting our climate. Often this leads to dramatic misinter- pretations in popular reviews, even in the Summary for Policymakers (IPCC‘s 6th assessment report AR6 [2]). On the other hand, for people with a clear feeling and understanding of real physical facts these exaggerations end in strong doubts about a man-made climate change and the existence of the greenhouse effect, which is almost exclusively based on theoretical considerations. The main reason of these doubts is a missing retraceable verification of the GHE, although there were continuous trials over the last 120 years to confirm or to refute this effect by more or less simple laboratory experiments. Direct measurements at the atmosphere are too strongly affected by convection, turbulence or scattering effects to quantify the relatively small contribution of greenhouse molecules to any local warming of the air or the Earth's surface, which is dominated by day-night and seasonal cycles with local variations of 60°C or more.Some Historical Notes
One of the frontier experimental investigations was performed by R. W. Wood (1909) [3], who used two boxes containing regular air. One box was covered with a glass window, transparent for sun light, but blocking IR-radiation, the other covered with a NaCl window, transparent also for IR. His measurements showed significant warming of the interior, but no or only a negligible temperature difference between the boxes. From this Wood and other authors, repeating his experiment (e.g., Allmendinger 2006 [4], Nahle 2011 [5]), concluded that infra- red radiation, which can escape through the NaCl window, will not contribute to heating, or only with an insignificant amount, while the observed temperature increase in both boxes - different to Fourier's interpretation - is exclusively explained due to the blockage of convective heat transfer with the environment and not related to any kind of trapped radiation. But experiments recording the temperature at the floor and ceiling of the interior, rather than looking only to a single temperature for each box, measure a 5°C larger floor to ceiling decline for the salt rock box than the glass box, while the bottom of the boxes have almost identical temperatures (V. R. Pratt 2020 [6]). These results are prin- cipally confirmed with a slightly different set-up using an internal electric heating instead of external light sources (E. Loock 2008 [7]). Such heating avoids differences in the incident radiation, which otherwise has to transmit windows of different materials and losses. A higher temperature of 2.5 - 3°C could be found for the glass box, and replacing the glass by a polished aluminum foil the temperature even rises by additional ~ 3°C. While the Wood-type experiments can answer the question, if and how far a reduced IR- transmissivity can contribute to warming of a compartment, respectively the troposphere, it gives no information about the interaction of greenhouse gases with IR-radiation. Thus, it still remained the question, to which extent such gases, at least partially, can withhold IR-radiation and how far simple absorption by GH-gases or the highly disputed back-radiation might contribute to additional warming of the floor. Such studies require to fill one compartment with the gas to be investigated and to compare this with a reference measurement using air or a noble gas. Meanwhile different approaches have been carried out, partly with external irradiation or with internal heating (see e.g., Loock [7]), partly measuring the gas temperature or the IR radiation in forward and backward direction (Seim&Olsen 2020 [8]). But either no warming was detected or, after closer inspection, the observed temperature increase could not be attributed to an IR- radiation effect. Unfortunately some fake demonstrations with apparent temperature differences of more than 10°C were presented in the internet, which allegedly revealed the strong impact of the greenhouse gases (see, e.g., Ditfurth 1978 [9]). However, closer inspection shows that the higher temperature is mainly caused by a stratification effect combined with an increased isolation, when heavier CO 2 is filled from the bottom into the compartment (M. Schnell 2020 [10]). And really problematic is, when the co-recipient of the 2007 Nobel Peace Prize initiates a web-based campaign with multiple advertisements on television, focused on spreading aware- ness for a climate crisis, and as "evidence" presents a completely unrealistic and unreprodu- cible video experiment of the GHE (Al Gore's Climate 101 video experiment 2001 [11]), which meanwhile has been falsified by several revisions (Watts 2011 [12], Solheim 2016 [13]). It is a dirty propaganda using such a manipulated experiment to spread fear around the word and to indoctrinate our society with the message that we can only rescue our Earth by stop- ping all future emissions of greenhouse gases. Such kind of demonstrations undermines any serious attempts to discuss and analyze the expected influence of GH-gases on our climate. Political imaginations, speculations or religious faith are no serious consultants to ensure a prosperous future; our knowledge and technical progress is based on scientific principles.Objective of our Studies
It‘s high time to stop the endless speculations about the disastrous implications or the non- existence of an atmospheric GHE and to concentrate on reliable investigations, which allow to quantify the size and limiting impact of GH-gases on global warming by anthropogenic emiss- ions of fossil fuels. In an actual study (Harde&Schnell 2022 [14]) we have summarized the theoretical background of the GHE and for the first time present quantitative measurements for the GH-gases CO 2 , CH 4 and N 2 O with an advanced experimental set-up, which has been developed by Michael Schnell and allows measurements under similar conditions as in the lower troposphere. A shortened, less technical version can be downloaded as PDF in English or in German [15]. For a gas layer located above a cooler subsurface, as known from inversion weather conditions or as observed in the Arctic and Antarctic during the winter months, the radiant power emitted by the surface and partially absorbed by the warmer gas layer, is lower than the power emitted upward. This corresponds to a negative greenhouse effect, which with a modified set-up can be reproduced for the first time in the laboratory (Schnell&Harde 2025 [16] and Harde&Schnell 2025 [17]). Our latest investigations include also water vapor with its strong influence on the radiation behaviour of the other GH-gases [17]. For a shortened version of the Negative Greenhouse- Effect (NGHE) see also Part I in English and German, Part II in German. To demonstrate the basics of the radiation exchange between bodies of different tempera- tures and to emphasize the special features of the GHE, we have also performed detailed studies, in which the GH-gases are replaced and simulated by a blackened metallic plate in a radiation channel (Schnell&Harde 2023 [18]). As introduction to the basics of the GHE, here we first consider this demo-experiment, before briefly reviewing our investigations with the GH-gases.Demo-Experiment with a Metallic Plate
Set-Up of the Radiation Channel
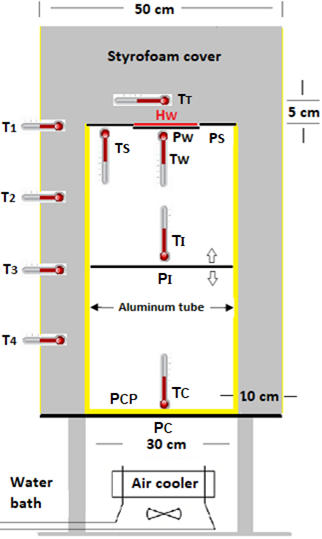
The experimental set-up for the demonstration of the radiation exchange and GHE consists of a vertical hollow cylinder made of Styrofoam. It is designed as a modular set-up and therefore, can easily be converted for different experiments (for details see: Schnell&Harde 2023 [18]). It contains two parallel metallic plates P W and P C in a distance of 60 cm, and for the simulation of the GHE an intermediate plate P I . The upper plate P W is black- ened and can be heated by an electric heating H W , the lower plate P C is also blackened and stabilized in its temperature by an air cooler. It is 1°C colder than the room temperature T R . This lower plate can be ex- chanched by a polished disc P CP of very low absorp- tivity, and thus, low emissivity. The inside of the compartment is lined with an alumi- num tube or a thin Al-foil, by which IR radiation can efficiently be directed from one plate to the other through multiple reflections and scattering. This en- ables an intense radiation exchange between the plates, and despite some smaller absorption losses at the inner wall, without the intermediate plate in the channel, more than 70% of the radiation can be transferred between the upper and lower plate. An unheated circular ring P S around the warm plate P W works as additional sensor for back-radiation and horizontal heat propagation. But the temperature T W and the heating power H W of the warm plate P W give the most important information for the investigations. This plate acts simul- taneously as heat source and sensor.Back-Radiation
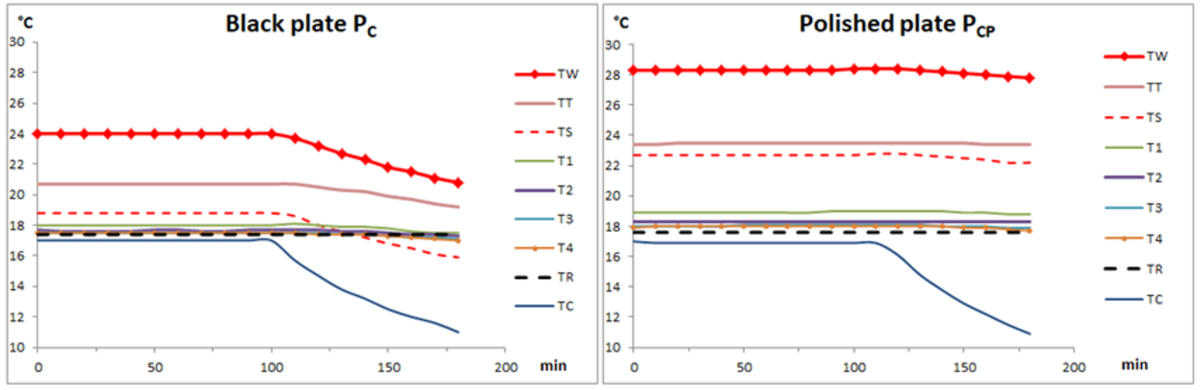
Quite controversially disputed is the thesis that a heated body can further be heated up by the radiation of a colder body or gas. This is seen as a violation of the second law of thermody- namics, although Clausius as one of the inventors of this law never questioned a mutual exchange of heat by radiation. While the IR-emission of the heated plate P W is clearly defined by its temperature T W and emissivity ε W ~ 1, the radiation from the environment, the so-called back-radiation, is inherent- ly much more complex. This radiation results from a superposition of emissions and reflec- tions that emanate from the cooled plate and the channel wall of the hollow cylinder. This can be clearly demonstrated by varying the surface and temperature of the base plate. For these measurements the intermediate plate P I is removed. The succeeding measurements illustrate, how the temperature of the constantly heated plate P W is influenced by the back-radiation. After having reached thermal equilibrium (~100 min), the black coated base plate P C is further cooled down from 17 to 11°C (left figure). Due to the Stefan-Boltzmann law, with increasing temperature difference the radiation exchange between the plates increases and the temperature T W decreases accordingly. When replacing the base plate by a polished disc P CP under otherwise same conditions, owing to the significantly reduced absorptivity α C , respectively emissivity ε C , the radiation transfer is reduced accordingly and the temperature T W increases, till thermal equilibrium is established (right figure). In contrast to the blackened plate, there is hardly any reaction to T W , when the P CP plate cools down. This is explained by the fact that with reduced emissivity, the reflectivity r C = 1 - ε C in- creases and the emission from the cooled plate is largely replaced by the reflected radiation from the warm plate. The radiation losses are reduced accordingly . A change in the thermal conductivity and convection as parallel heat flows and as possible reasons of these effects can be ruled out in these experiments (see also Schnell&Harde 2023 [18], Sec. 6).Simulation of the Greenhouse Effect
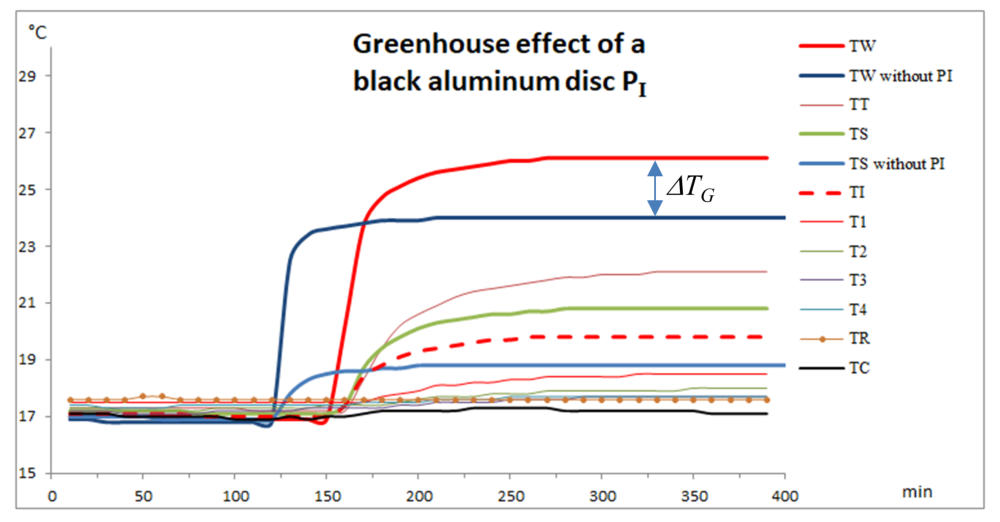
When placing a blackened thin Al-plate as intermediate disc P I into the radiation channel, it interrupts the radiation exchange through an absorption-emission cycle, whereby the energy supplied, is again released on both sides by infrared radiation. This process, in principle, corre- sponds to the effect of greenhouse gases in the atmosphere, with the difference that in the black disk all available wavelengths of a Planck radiator are affected by the absorption-emis- sion interruption. In this model experiment, the cooled plate P C is the energy sink, the place where the net energy transmitted by IR radiation is dissipated. The model experiment can also be viewed as a simulation of the impact of clouds on the radia- tion exchange. In this sense, the disk P I simulates a complete cloud cover and P W the Earth's surface. A further sensor on the disk P I provides information about the temperature T I that occurs at this location, which would correspond to the temperature of the gases or clouds. By definition, the measure of the greenhouse effect is the temperature increase ΔT G of the warm plate compared to a measurement without a plate P I but the same heating H W . In three experimental set-ups, that differ only in the distance between the disk P I and the warm plate, the existence of this plate in the beam path causes well observable temperature differences of up to 2.0 °C. For the plates P W and P S , the source of the back-radiation is no longer plate P C , but the warmer plate P I with the temperature T I (Dashed Red). This results in an increase in the temperature T W (Red) and T S (Light Green). For comparison are shown the temperatures T W and T S without disk P I (Blue lines).Experiments with Greenhouse Gases
Experimental Set-Up for Measurements with GH-Gases
Similar to the previous set-up we use two plates in a closed housing, an upper plate, called earth-plate, which is heated to 30°C, and a cooled plate at the bottom (atmospheric plate, atm- plate), stabilized to -11.4°C . Their distance is 111 cm. No additional light sources in the visible or IR are used, only the radiation emitted by the two plates and interacting with the gases is considered. For further details, see Harde & Schnell 2022 [14]. This simulates conditions for the radiation exchange similar to the Earth-Atmosphere- System (EASy) with the warmer Earth's surface and the colder atmosphere. It also avoids any problems caused by an inapprop- riate spectral range of an external source, which produces a lot of waste heat in the compartment and the windows, but is not well matched to the absorption bands of the GH-gases, and thus significantly reduces the measurement sensitivity. With the sample gas in the tank the heated earth-plate again acts simultaneously as radiation source and as sensitive detector for the back-radiation from GH-gases. In this way, the pure radiation effect of the gases is measured as a direct temperature increase ΔT E of the earth-plate or, alternatively at stabilized tempera- ture T E , as energy saving of the plate heating ΔH E . This set-up allows to a large extent to eliminate convection or heat conduction and to repro- ducibly study the direct influence of GH-gases under similar conditions as in the lower tropo- sphere. Any noticeable impact due to heat conduction can be excluded by control experiments with noble gases.Some Physical Basics
Spectral Absorption and Emission
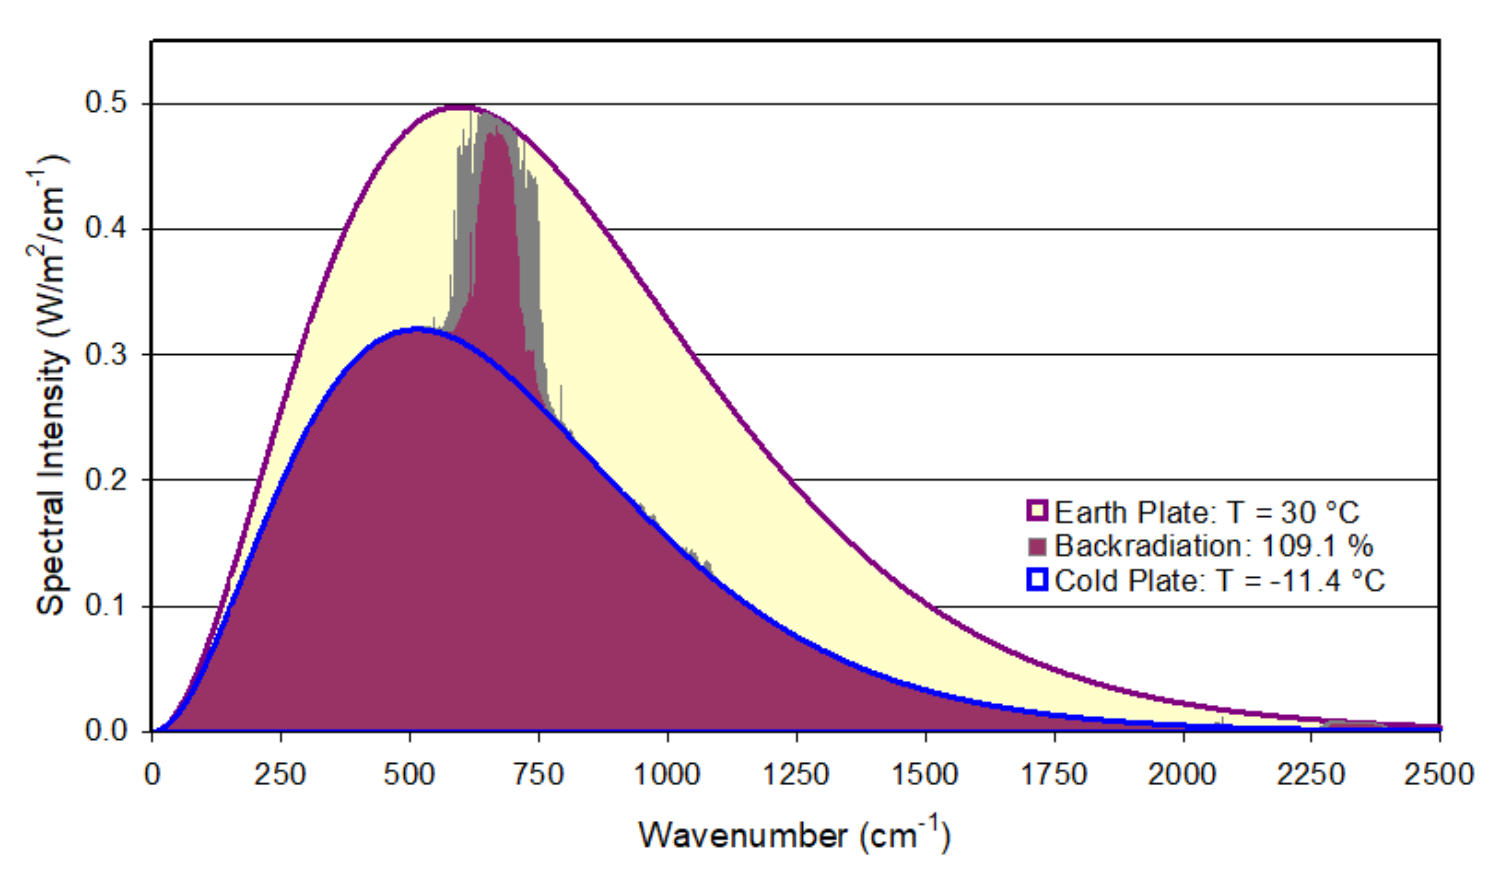
In good approximation can the Earth's surface, or here the black colored earth-plate and also the atm-plate, be assumed to radiate as black bodies with a Planck distribution, which is only controlled by the temperature of the body. On a wavelength scale the respective spectrum extends from about 4 µm up to the cm range, or in reciprocal wavelengths 1/ as wavenum- bers (units: cm -1 ) from 10 to 2,500 cm -1 . This Figure displays the emitted spectrum of the earth-plate for T E = 30°C (Red) and the atm- plate at T A = -11.4°C (Blue). Different to nitrogen, oxygen or the noble gases, the GH-gases can absorb and emit radiation in this spectral range. For CO 2 , e.g., the dominating interaction takes place on the ro-vibronic transitions of the bending mode around 670 cm -1 (15 µm). Due to this interaction the net result for radiation propagating from the warm to the cold plate is that the spectral intensity over the absorption band is attenuated (but far from opacity), while radiation in backward direction (to the earth- plate) is further 'amplified'. A calculation for the latter case and for 20% CO 2 in dry air over 111 cm is shown as Plum Area. The additional emission of CO 2 can well be identified as a larger peak around 670 cm -1 (Plum-Gray). On the stronger lines at the band center the gas emission already attains saturation with spectral intensities, which are the same as those emitted by the earth-plate (Red Line) in this spectral range. Such calculation considers a continuous absorption-emission sequence for the propagating radiation and is known as Radiation Transfer calculation (RT-calculation using the Schwarz- schild equation). Compared to the total radiated intensity of the atm-plate with I A = 266 W/m 2 the back-radiation increases by 24.2 W/m 2 , which is 9.1%. This larger back-radiation is almost identical to the losses in forward direction (see Short Version, Fig. 3) so that within observational accuracies the total balance of absorption and emission of the gas is zero. This is an important aspect that speaks against measuring the gas temperature to prove the GHE. On the other hand, with the presented set-up the back-radiation of the GH-gases can well be detected as temperature rise ΔT E of the earth-plate.Objections against the Greenhouse Effect
Collisions:
One of the most common objections against the GHE is that GH-gases would not emit in the lower atmosphere, while they are good emitters in the tropopause and stratosphere. As explanation critics state that in the lower troposphere collision processes with nitrogen and oxygen suppress any spontaneous emission and the absorbed energy is only converted into kinetic energy and thus into heat. Unfortunately such interpretation overlooks that the typical collision rates of several GHz, as observed in the lower atmosphere, are only reducing by a factor of 4 - 5 at an altitude of 11 km and therefore are still some 100 million times larger than the spontaneous transition rate on the CO 2 bending mode (~1 Hz). When such interpretation would be true, there would also be absolutely no emission in the higher atmosphere. Instead, continuous emission occurs even without prior absorption of an IR light quantum, because in addition to superelastic collisions (collision-induced transitions from a higher to a lower molecular state) also inelastic collisions take place, which remove kinetic energy from the gas mixture and convert it back to excite the GH-gas molecules (Harde 2013 [19], Subsec. 2.3). Thus, lower-lying energy levels are continuously re-populated, when there is sufficient thermal energy, and spontaneous emission occurs largely independently - parallel to superela- stic collisions - as thermal back-ground radiation (Harde 2013 [19], Subsec. 2.5). This emission is controlled by the temperature of the air and is the main reason that with increasing altitude the radiated intensity is significantly decreasing. So, at an altitude of 11 km for CO 2 , e.g., it is just 12% of the intensity observed in a 100 m thick gas layer close to the ground. Collisions (adiabatic and diabatic) are primarily noticeable as spectral broadening of the lines. But on these frequencies and over longer pathlengths the radiation can achieve the same strength as a blackbody radiator, and at thermal equilibrium this is mainly controlled by the gas temperature T G . Would GH-gases only absorb but not emit in the lower troposphere, not only the back-radiation but also the forward-radiation, and thus, the most efficient upward heat transport would be sup- pressed. As a consequence, even more heat would accumulate in the lower layers and heat up the surface stronger than any back-radiation.Second Law of Thermodynamics:
Another objection is that the radiation from a cooler body cannot be absorbed by a warmer body, as this would violate the 2nd law of thermodynamics. As alredy shown above, this is nonsense. Also our measurements with this set-up, in which the temperature of the atm-plate is gradually increased and the warming of the earth-plate or its reduced heating capacity is measured, gives clear evidence of a wrong interpretation of this law, which explicitly includes "simultaneous double heat exchange by radiation" (Clausius). In a closed system, "the colder body experiences an increase in heat at the expense of the warmer body", which in turn experiences a slower rate of cooling. In an open system with external heating, the back-radiation from the cooler body clearly leads to a higher temperature of the warmer body than without this radiation (Short Version, Fig. 4). From such measurement also the radiation loss caused by divergence and reflection at the side walls can be determined. At the same time, the observed temperature increase as a function of the heating power H E provides a calibration for the temperature response sensitivi- ty l E of the earth-plate.Measurements
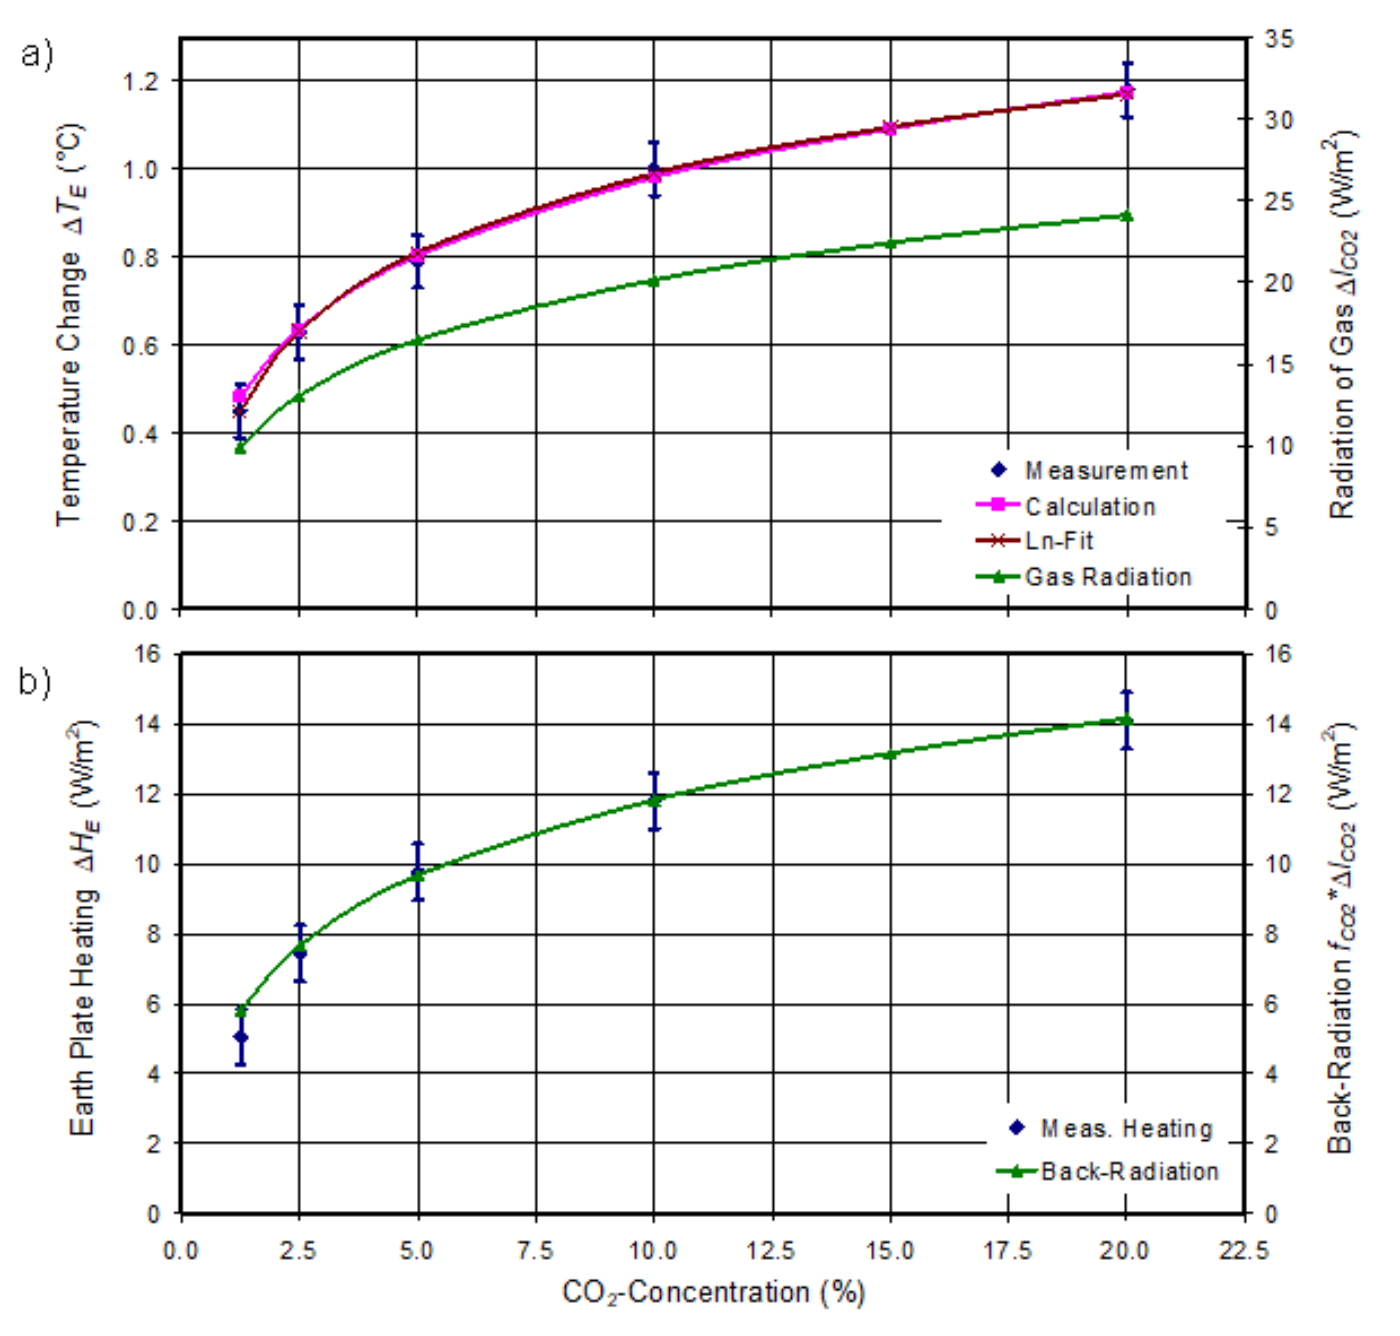
We have investigated the GH-gases CO 2 , CH 4 and N 2 O over a wide range of concentration changes up to a factor of 16. Our measurements show a clear response to the GH-gases but also a strong saturation in the temperature incline with increasing concentration, and they are in excellent agreement with detailed RT-calculations.CO
2
-Measurement
Figure a) displays the measured temperature increase DT
E
at the earth-plate as a function of
the CO
2
-concentration in dry air, which was increased stepwise from 1.25% up to 20% (Blue
Diamonds).
As direct comparison is also plotted the calculated temperature increase T C = E f CO2 I CO2 (Magenta Squares), based on an RT-calculation of the CO 2 back-radiation DI CO2 (Green Trian- gles), only multiplied by a calibration factor (transmitted fraction) f CO2 for the collected radiation (see below) and the separately measured temperature response l E of the earth- plate. Measurement and calculation are well represented by a logarithmic plot of the form T E = E f CO2 F CO2 ln(C CO2 /C 0 )/ln2 (Brown Crosses) as a function of the concentration C CO2 in dry air. From this we derive the CO 2 radiative forcing at doubled CO 2 concentration of F 2xCO2 = 3.7 W/m 2 . The lower plot b) shows the saved heating H E for the earth-plate (Blue Diamonds) when stabi- lizing this plate at a fixed temperature (30°C), while increasing the CO 2 concentration. This is an independent means for detecting the back-radiation, which can well be reproduced by the calculated back-radiation DI CO2 times the transmitted fraction f CO2 = 59% that reaches the plate and is absorbed (Green). This fraction f CO2 is derived from a fit to the saved heating H E .CH
4
-Measurement
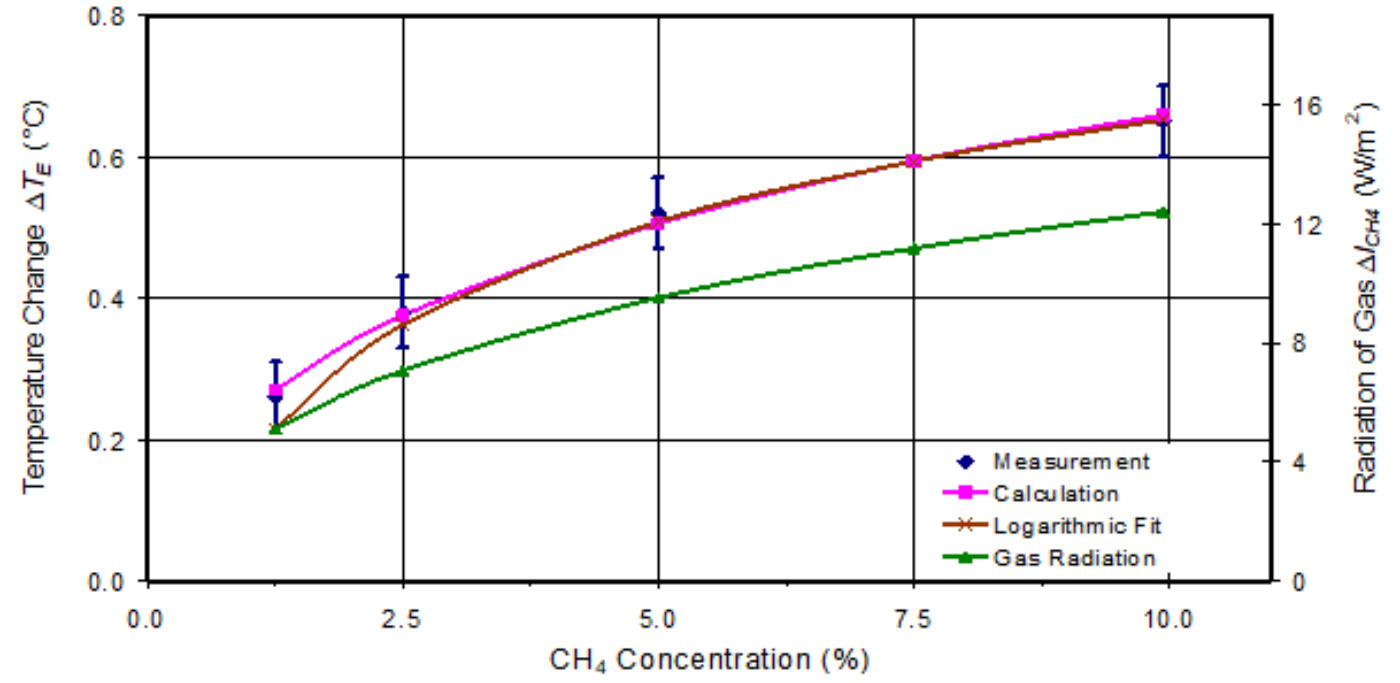
Measurements for CH
4
were performed for concentration changes from 1.25 to 10% in dry air.
The observed temperature increase DT
E
of the earth plate as a function of the CH
4
concentra-
tion (Blue Diamonds) shows again excellent agreement with the calculated temperature
increase (Magenta Squares) based on the calculated back-radiation DI
CH4
(Green Triangles).
Except for the lowest concentration also this GH-gas indicates strong saturation at these con-
centration levels and can quite well be represented by a logarithmic plot (Brown Crosses) with
a radiative forcing at doubled CH
4
concentration of DF
2xCH4
= 2.75 W/m
2
. Under otherwise
comparable conditions this is only 74% of the CO
2
forcing. Although the atmospheric
concentration of CH
4
with 1.8 ppm is more than 200x smaller than CO
2
, over the optical path,
which is proportional to the concentration x propagation length, also CH
4
shows stronger
saturation in the atmosphere (see also: c) Methane Sensitivity).
N
2
O-Measurement
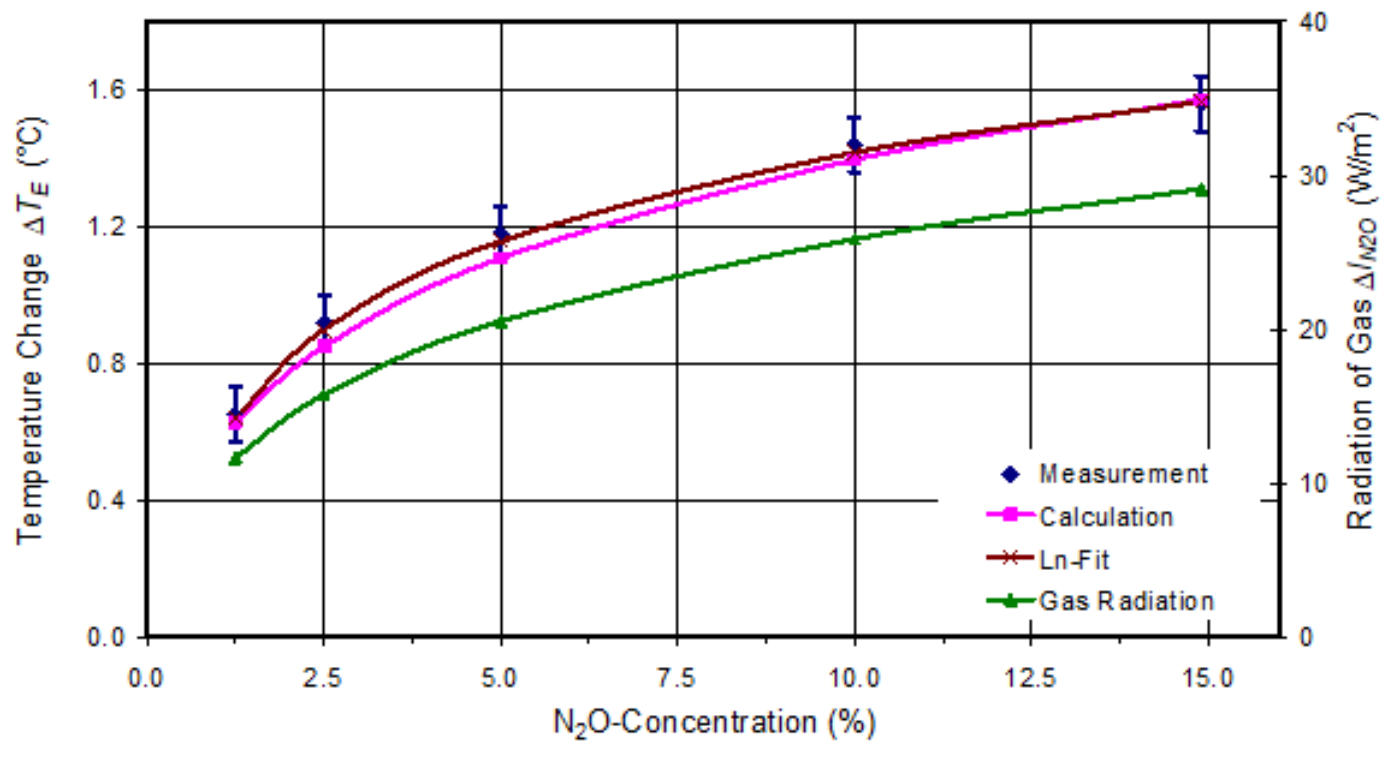
The N
2
O measurements were performed for concentrations of 1.25% up to 15%. The recorded
temperature change T
E
of the earth plate with increasing N
2
O concentration (Blue Diamonds)
can again well be reproduced by the calculated change T
C
=
E
f
N2O
I
N2O
(Magenta Squares).
The theoretical N
2
O emission I
N2O
is shown as Green Triangles.
The measured temperature also fits well to a logarithmic curve (Brown Crosses) and gives an N 2 O radiative forcing at doubled concentration of F 2xN2O = 5.0 W/m 2 , which is 35% greater than the forcing of CO 2 .Results
Differences to Atmosphere
The experimental set-up has proven to be appropriate for demonstrating the atmospheric GHE in the laboratory. Although the pathlength through the atmosphere is about a factor of 80,000 larger than in the tank, this is partially compensated by a 500x higher concentration for CO 2 , a 50,000x larger CH 4 -concentration, and it is even significantly overcompensated for N 2 O with an almost 500,000x higher concentration relative to the sea-level values. Not so much the absolute values are relevant, more important is the optical depth, which scales with the ab- sorption coefficient x pathlength. Under real atmospheric conditions is the back-radiation of the GH-gases superimposed by the much broader radiation from clouds, which in first approximation can be assumed as gray emitters with a temperature given by their bottom side, only with an emissivity < 1. In our experiment clouds are substituted by the atm-plate and walls. Their radiation is strongly changing with the temperature of the atm-plate T A and in this way simulates the impact of clouds at different heights. But it also affects the size of the GH-gas contribution, which depends on the temperature difference between the plates and by this on the lapse-rate. Transferred to the atmosphere this means that with clouds the back-radiation is larger than for clear sky, but the relative contribution caused by GH-gases is declining.Comparison with Literature
We find good agreement between measurement and calculation for all three gases, this for the temperature data as well as for the plate heating. Particularly the increasing saturation and the characteristic gradation with inclining gas concentration is well confirmed by the cal- culations and excludes any larger impact by heat conduction. At the same time these graphs demonstrate the only small further impact on global warming with increasing GH-gas concen- trations. While the coincidence in the absolute values of measured and calculated data to some part is a consequence of using the theoretical reference for deriving f G as scaling factor for the absorbed back-radiation and the temperature plots, is the almost exact agreement of the derived radiative forcing for CO 2 with F 2xCO2 = 3.70 W/m 2 more an unexpected coincidence with the literature (see AR6 [20]), as the measurement here was deduced under quite different conditions. Nevertheless allows this some direct comparison with each other, it only requires to consider the different impacts like a changing pressure broadening of the absorption lines over the pathlength in the atmosphere, the interference with other GH-gases like water vapor, the different ground temperature, and the changing back-radiation with varying cloud altitude, overcast and emissivity. From this we calculate a radiative forcing of F 2xCO2 = 3.4 W/m 2 , and to- gether with a Planck response of P = 0.31 °C/(W/m 2 ) (see AR6 [20]) this gives a basic Equili- brium Climate Sensitivity (temperature increase at doubled CO 2 concentration, without feed- backs) of ECS B = P F 2xCO2 = 1.05°C. This result is in excellent agreement with the Coupled Model Intercomparison Project Phase 5 (CMIP5). However, including also feedbacks, own calculations show that in contrast to the assumptions of the IPCC, water vapor only contributes to a marginal positive feedback, and evaporation at the Earth's surface even leads to a significant further reduction of the climate sensitivity to only ECS = 0.7°C (Harde 2017 [21]). This is less than a quarter of the IPCC value with ECS = 3°C (AR6 [20]) and 5.4x smaller than the mean value of CMIP6 with ECS = 3.78°C. The found forcings for CH 4 and N 2 O can only indirectly be compared with the literature, as respective values are only specified for a concentration range (parts per billion) before satur- ation is observed. Nevertheless their relative values to CO 2 still allow a direct assessment of their contribution to global warming, which is not more than 2% for CH 4 and less than 1% for N 2 O (see also c) Methane).Negative Greenhouse-Effect
For our studies of the negative greenhouse effect again we use an experimental set-up con- sisting of a vertically placed cylinder, but different to the previous arrangements without heated or cooled plates in the cylinder [17]. Instead, the walls are indirectly and uniformly heated, and at the bottom the compartment is sealed with an infrared-transparent foil. Below this foil are two calibrated radiation sensors on a cooled plate, which measure the radiation emerging from the cylinder. At the same time, the temperature distribution in the container is recorded before and after adding a greenhouse gas. With this set-up we have investigated the gases water vapor, CO 2 , CH 4 , N 2 O, and Freon 134a at varying concentrations between 1 – 8% in air and at normal pressure. The radiation emitted by the gases can be detected against a larger background radiation originating from the cylinder walls. E.g., with 2% CO 2 , 1% humidity and an effective emissivity of the cylinder walls eff = 42%, this results in an expected spectral intensity as shown below. The total CO 2 emission (red) with 29 W/m 2 contributes only 5.3 W/m 2 compared to the wall emission (grey) and water vapor (blue), together with 90.3 W/m 2 . This is not more than 5.5% of the total intensity with 96 W/m 2 . These calculations show that with such a laboratory experi- ment, similar to an iceberg, basically only the tip of the gas radiation can be measured. All investigated gases show strong saturation effects with increasing concentration. The measurements can well be reproduced by corresponding radiation transfer calculations. A clear influence of water vapor on the other gases is also evident as increased background radiation and partial spectral superposition with these gases, which appears as attenuated emission of these gases. Likewise, with increasing radiation — particularly for the stronger greenhouse gases — simultaneous cooling of the gases across the cylinder volume can be observed. This is ex- plained by conversion of kinetic and thus thermal energy into radiation, which can escape through the infrared transparent foil. For a gas layer located above a cooler subsurface, as known from inversion weather conditions or as observed in the Arctic and Antarctic during the winter months, the radiant power emitted by the surface and partially absorbed by the warmer gas layer, is lower than the power emitted upward. This corresponds to a negative greenhouse effect, which with the presented set-up can be reproduced for the first time in the laboratory. For further details, see Harde&Schnell 2025 [17] and two shorter, less technical versions: Part 1 in English and German, Part 2 in English and German.Conclusion
The presented measurements and calculations clearly confirm the existence of an atmo- spheric GHE, and they demonstrate, contrary to the often misinterpreted 2nd law of thermo- dynamics, that a warmer body can further be heated by absorbing the radiation from a colder body, here the radiation from the cooled plate, an intermediate plate or a GH-gas. They also confirm that GH-gases are still emitting IR-radiation in ‘backward‘ direction under conditions as found in the lower atmosphere. At the same time reveal our studies the principal difficulties to measure the GH-effect only as increasing temperature of the gas, which in classical set-ups is mainly dominated by indirect effects like heat exchange with the compartment walls, while an important prerequisite for its observation is missing: The GHE is mainly the result of a temperature difference over the propa- gation path of the radiation and thus the lapse rate in the atmosphere. Our results only show a small impact of GH-gases on global warming, which apparently is much more dominated by natural impacts like solar radiative forcing (see, e.g., Connolly et al. 2021 [22]; Harde 2022 [23]; e) Solar Influence). So, there is no reason for panic and climate emergency, instead it is high time to come back to a consolidated climate discussion, which concentrates on facts and also includes the benefits of GH-gases.References
1. J. B. Fourier, 1824: Remarques Générales Sur Les Températures Du Globe Terrestre Et Des Espaces Planétaires. In: Annales de Chimie et de Physique, Vol. 27, 1824, S. 136–167, https://books.google.co.uk/books?id=1Jg5AAAAcAAJ&pg=PA136&hl=pt- BR&source=gbs_selected_pages#v=onepage&q&f=false 2. IPCC, 2021: Summary for Policymakers. In: Climate Change 2021: The Physical Science Basis. Contribu- tion of Working Group I to the Sixth Assessment Report of the Intergovernmental Panel on Climate Change [Masson-Delmotte, V., P. Zhai, A. Pirani et al. (eds.)]. Cambridge University Press, pp. 3−32, doi:10.1017/9781009157896.001. 3. R. W. Wood, 1909: Note on the Theory of the Greenhouse, London, Edinborough and Dublin Philosophical Magazine, Vol. 17, pp. 319-320. https://zenodo.org/record/1430650#.Yoo9kPTP1EY 4. T. Allmendinger, 2006: The thermal behaviour of gases under the influence of infrared-radiation, Int J Phys Sci 11: 183-205. https://academicjournals.org/journal/IJPS/article-full-text-pdf/E00ABBF60017 5. N. S. Nahle, 2011: Repeatability of Professor Robert W. Wood’s 1909 experiment on the Theory of the Greenhouse, Biology Cabinet Online-Academic Resources and Principia Scientific International, Monterrey, N. L. https://principia-scientific.org/publications/Experiment_on_Greenhouse_Effect.pdf 6. V. R. Pratt, 2020: Wood's 1909 greenhouse experiment, performed more carefully, http://clim.stanford.edu/WoodExpt/ 7. E. Loock, 2008: Der Treibhauseffekt - Messungen an einem Wood'schen Treibhaus, https://docplayer.org/30841290-Der-treibhauseffekt-messungen-an-einem-wood-schen-treibhaus-von- ehrenfried-loock-version.html 8 . T. O. Seim, B. T. Olsen, 2020: The Influence of IR Absorption and Backscatter Radiation from CO 2 on Air Temperature during Heating in a Simulated Earth/Atmosphere Experiment , Atmospheric and Climate Sciences, 10, pp. 168-185, https://doi.org/10.4236/acs.2020.102009 . 9 . H. v. Ditfurth, 1978: Studio-Demonstration in German TV, ZDF TV-Series "Querschnitte". 10. M. Schnell, 2020: Die falschen Klimaexperimente, https://www.eike-klima-energie.eu/2020/11/06/die-falschen-klima-experimente/ 11. A. Gore, D. Guggenheim, 2006: An Inconvenient Truth, Movie, https://www.imdb.com/title/tt0497116/ 12. A. Watts, 2011: Replicating Al Gore's Climate 101 video experiment shows that his "high school physics" could never work as advertised, https://wattsupwiththat.com/2011/10/18/replicating-al-gores-climate-101-video-experiment-shows-that-his- high-school-physics-could-never-work-as-advertised/?cn-reloaded=1 13. J.-E. Solheim, 2016: Start des zweitägigen „Al Gore-Experiments", 10. Internationale Klima- und Energie- Konferenz (10. IKEK), EIKE, Berlin, https://www.eike-klima-energie.eu/2017/02/04/10-ikek-prof-em-jan-erik- solheim-start-des-zweitaegigen-al-gore-experiments/. 14. H. Harde, M. Schnell, 2022: Verification of the Greenhouse Effect in the Laboratory, Science of Climate Change, Vol. 2.1, pp. 1-33, https://doi.org/10.53234/scc202203/10. 15. H. Harde, M. Schnell, 2022: Experimental Verification of the Greenhouse Effect Download PDF in English Nachweis des Treibhauseffekts im Labor Download PDF in German 16. M. Schnell, H. Harde: The Negative Greenhouse Effect – Part I: Experimental Studies with a Common Laboratory Set-Up, Science of Climate Change 2025. Vol. 5.3, pp. 1 - 9, https://doi.org/10.53234/scc202510/02 17. H. Harde, M. Schnell, 2025: The Negative Greenhouse Effect – Part II: Studies of Infrared Gas Emission with an Advanced Experimental Set-Up, Science of Climate Change 2025. Vol. 5.3, pp. 10 - 34, https://doi.org/10.53234/scc202510/03 Shortened version: Part 1 - English, Part 1 - German; Part 2 - English, Part 2 - German 18. M. Schnell, H. Harde, 2023: Model-Experiment of the Greenhouse Effect, Science of Climate Change, Vol. 3.5, pp. 445 - 462, https://doi.org/10.53234/scc202310/27 19. H. Harde, 2013: Radiation and Heat Transfer in the Atmosphere: A Comprehensive Approach on a Molecular Basis, International Journal of Atmospheric Sciences (Open Access), vol. 2013, http://dx.doi.org/10.1155/2013/503727 20. Sixth Assessment Report (AR6) of the IPCC, 2021: Climate Change 2021: The Physical Science Basis, Contribution of Working Group I to the Sixth Assessment Report of the Intergovernmental Panel on Climate Change [Masson-Delmotte, V. et al. (eds.)]. Cambridge University Press. https://www.ipcc.ch/report/ar6/wg1/downloads/report/IPCC_AR6_WGI_TS.pdf 21. H. Harde, 2017: Radiation Transfer Calculations and Assessment of Global Warming by CO 2 , International Journal of Atmospheric Sciences, Volume 2017, Article ID 9251034, pp. 1-30, https://www.hindawi.com/journals/ijas/2017/9251034/, https://doi.org/10.1155/2017/9251034. 22. R. Connolly, W. Soon, M. Connolly, S. Baliunas, J. Berglund, C. J. Butler, R. G. Cionco, A. G. Elias, V. M. Fedorov, H. Harde, G. W. Henry, D. V. Hoyt, O. Humlum, D. R. Legates, S. Lün-ing, N. Scafetta, J.-E. Solheim, L. Szarka, H. van Loon, V. M. V. Herrera, R. C. Willson, H. Yan and W. Zhang, 2021: How much has the Sun influenced Northern Hemisphere temperature trends? An ongoing debate, Research in Astronomy and Astrophysics 2021 Vol. 21 No. 6, 131(68pp), http://www.raa-journal.org/raa/index.php/raa/article/view/4906 23. H. Harde, 2022: How Much CO 2 and the Sun Contribute to Global Warming: Comparison of Simulated Temperature Trends with Last Century Observations, Science of Climate Change, vol. 2, no 1, pp 105 -133, https://doi.org/10.53234/scc202206/10.

Experimental Set-Up

LBL-RT-calculation for 20% CO
2
in air over 111 cm.
Set-Up of Allmendinger [4]

![Experimental Set-Up of Allmendinger [4]](index_htm_files/32195.jpg)


Experimental Set-Up for NGHE